We have seen in a previous article that it is possible to create maps in Tableau using various methods. Your starting point will always be that Tableau will need to know the geographical coordinates of what is actually drawn on your map, be it a city, the location of a building, or any geographic place of importance for your data mapping.
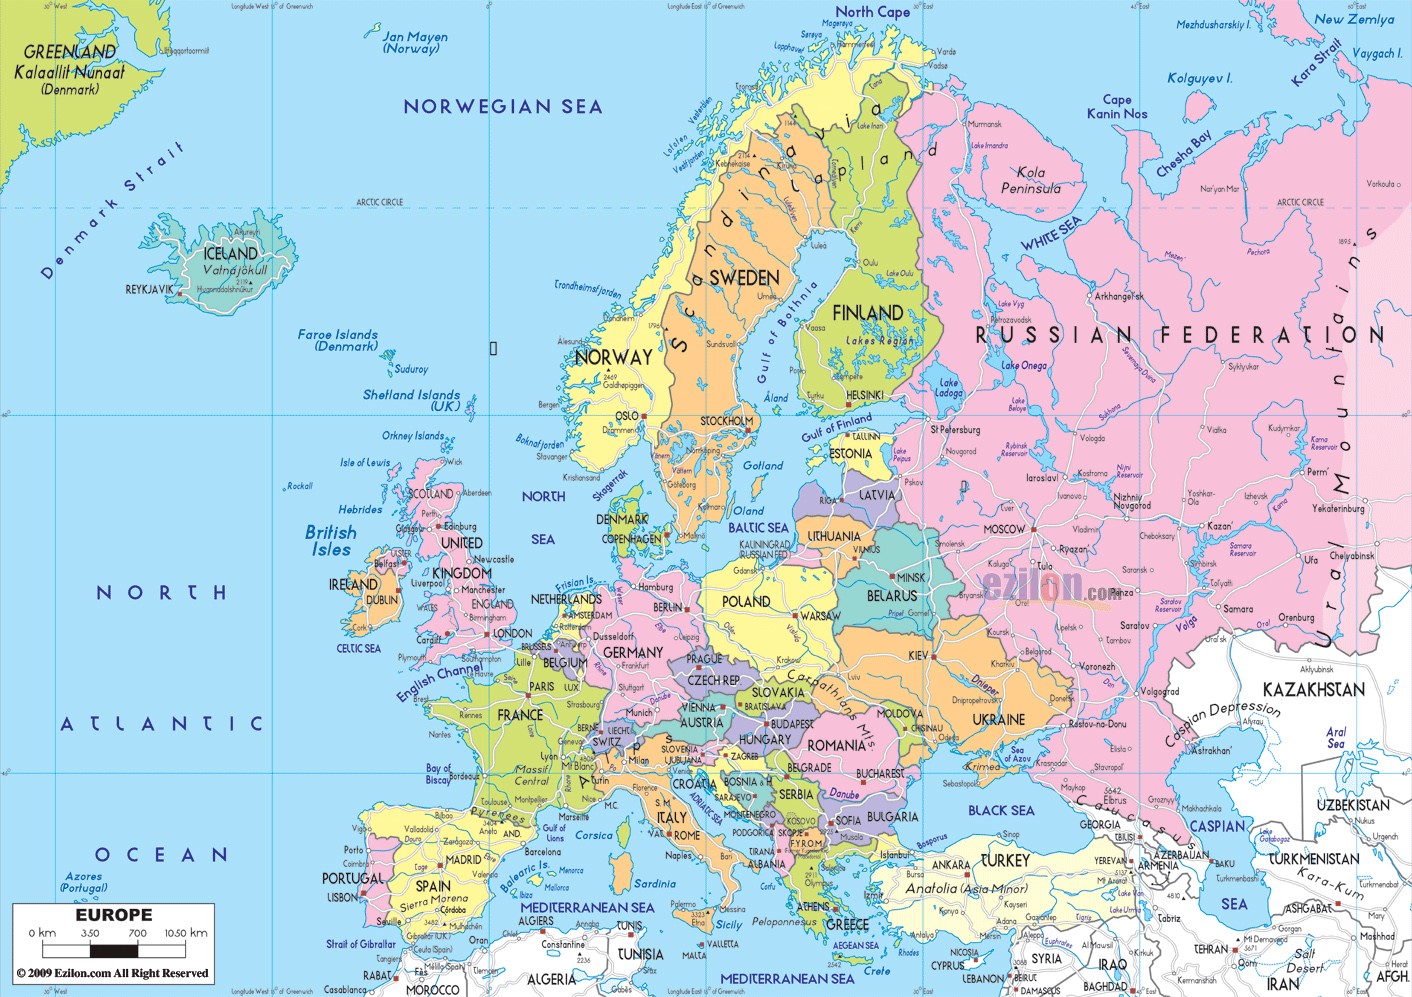
As a result, and in many cases, you may not need to download a detailed map to start your visual analysis. For instance, a map like the one below shows too much irrelevant information like cities and rivers. A simpler one with an outline of countries will be easier to use to overlay your data, and that’s where the integration of GIS files in Tableau becomes handy.
Using Spatial files
Tableau can create maps using spatial files which are GIS files. For those not familiar with GIS files, this type is the standard file format used by most organizations that create maps, which makes GIS files widely available.
Note: Tableau will accept the following types of GIS files:
- Shapefiles;
- MapInfo TAB files;
- KML (Keyhole Markup Language) files;
- GEOJSON files.
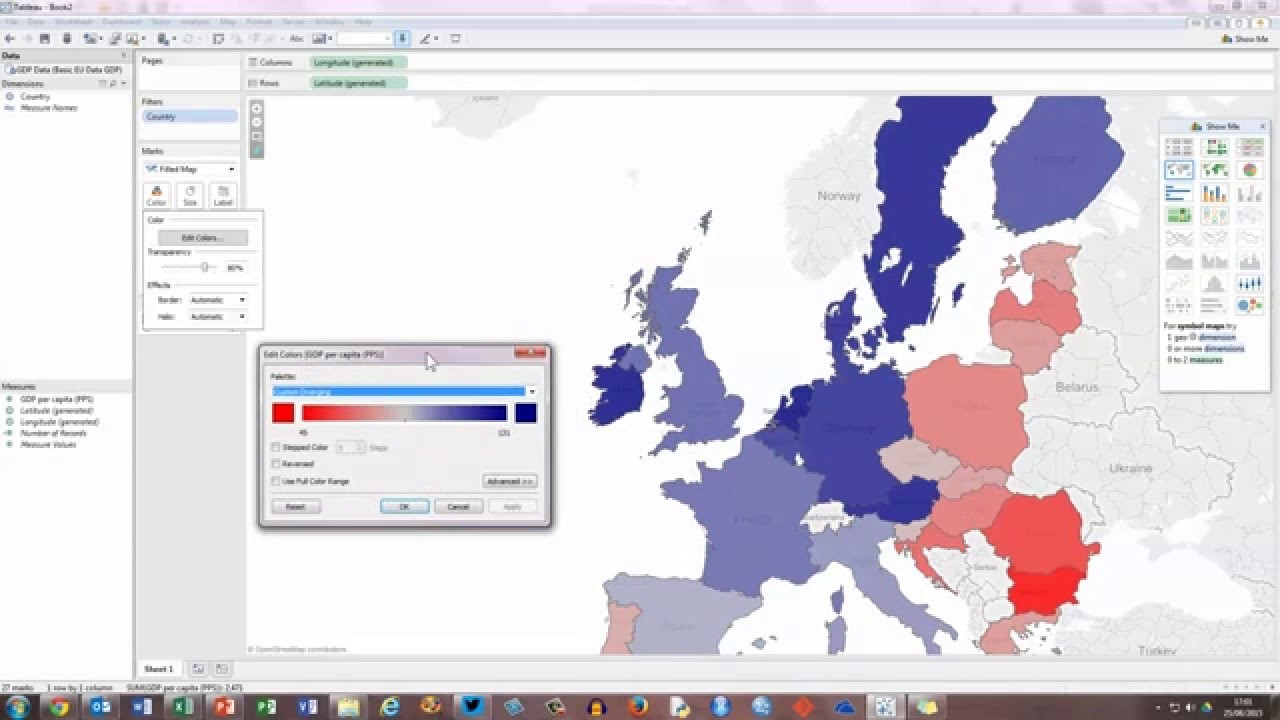
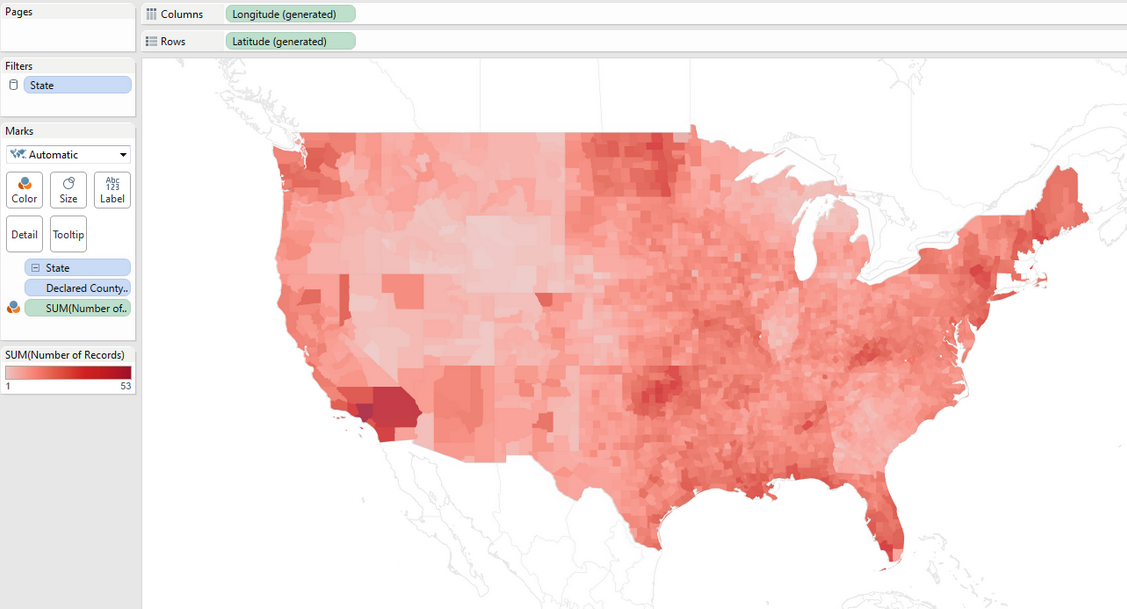
GIS files represent a map using lines, points, and polygons to define an area on the map such as lakes, park boundaries, city boundaries, etc… In Tableau, you can use the polygons to map data on the area itself, like in the example below.
Where Can You Find Spatial files?
You can find spatial files on most government organization websites and data portals.
Here are some examples:
ESRI open Data
Naturalearthdata.com
OpenStreetMap
Terra Populus
Note: With most GIS files, several files are required to allow you to open the map file in Tableau and you will need to download the entire folder of map files. For example, if you are using ESRI Shape files, your folder must contain .shp, .shx and .dbf files.
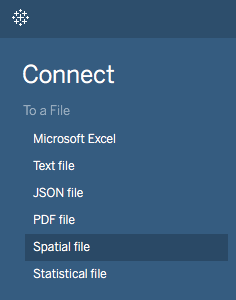
Connecting to Your Spatial File
The process of connecting to your map data file is the same as with other file types:
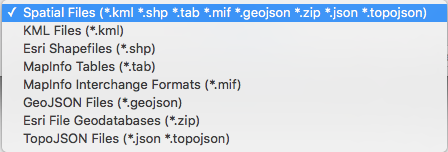
By going to Connect > Spatial file in the menu connect.
And browsing to the location of your files.
As soon as Tableau reads the file, it converts it to latitude and longitude coordinates and creates a Geometry field. You can then double-click the Geometry field to display the download map in Tableau.
Adding Your Data to the Map
Depending on the type of map you wish to create, you will proceed differently.
For a choropleth map, this is done by dragging your data field onto the color mark card.
Here we used red as an example.
You can then edit your color and choose between a monochrome palette to represent your data. In other cases, if your data presents negative values, you will want to use a diverging color palette.
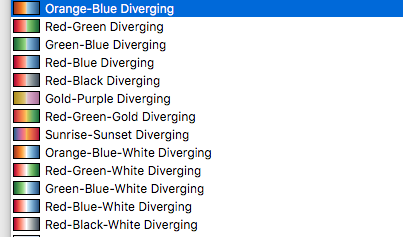
Tableau goes further by allowing you to choose the number of steps, which could be your number of individual polygons...
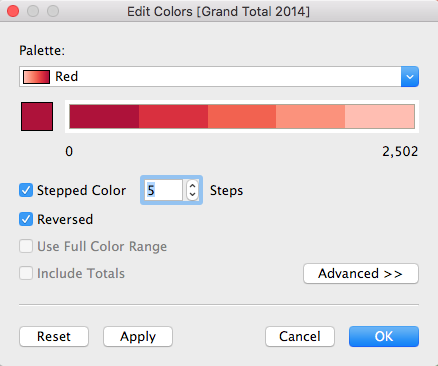
...and the range of values to narrow the scope of analysis from within your visualization.
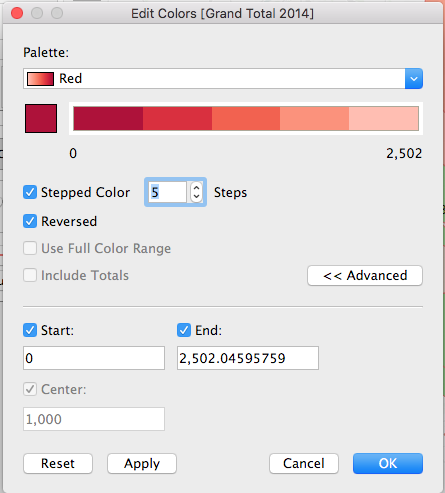
This is particularly useful since you can see your values changes on your map as you edit the color panel, unraveling geographic patterns for your data.
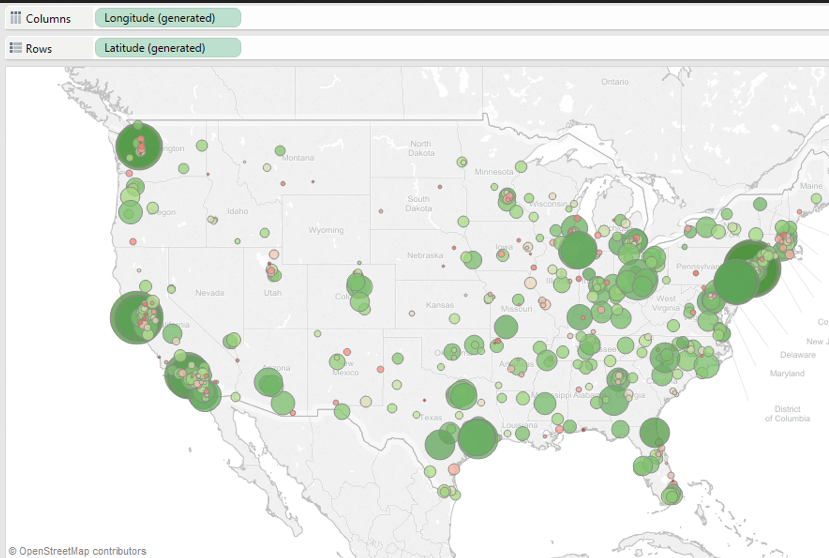
In other approaches, you might use the size card to map your data.
Combining multiple layers of data
If you wish to compare two or more variables (or measures) on the same map, the best approach will be to use dual-axis layers to create multi-layered maps. You can then use the size, color and shape mark cards to add the data to your map.
In some cases, if your measures are of the same order and you wish to compare them side by side, a bivariate choropleth map might be useful. This is a different approach that takes into account that bivariate choropleth maps combine two datasets where we are gauging how more of each variable is present in each polygon. I will detail both approaches in the next article of this three-part series on maps.
Conclusion
While there are many routes to mapping your data, you will find that starting with shapefile offer many possibilities. There are however some limitations to using polygon maps files. As although letting our data speak for itself is appealing, we often find it has too much to say, and we can end up with overlaying too much data on our map, more than is necessary to see the geographic patterns.