Parameters are a powerful feature within Tableau. They expand the possibilities of how you interact with the data in your visualization. By allowing you to incorporate them to manipulate variables dynamically in calculations, as well as in filters and reference lines, you get a better insight into criteria that can modify your analysis. You can think of parameters as tools to create different scenarios around your data.
What Are Parameters?
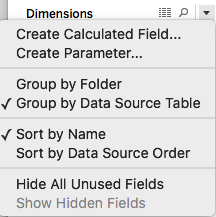
Parameters are dynamic values you set to replace constant values in calculations, filters, and reference lines. In your data pane, your first step is to create a parameter by clicking the arrow next to Dimensions and selecting Create Parameter from the menu.
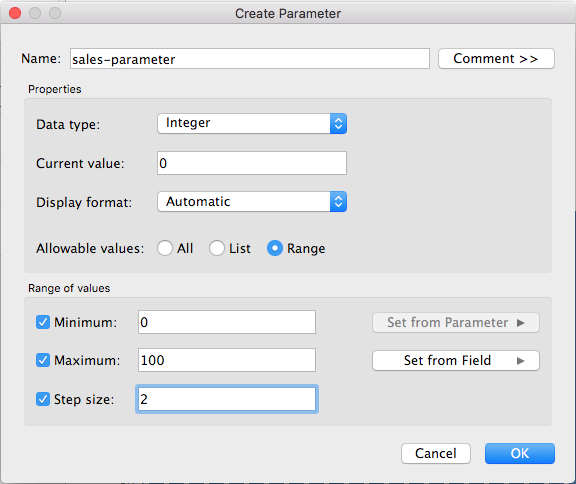
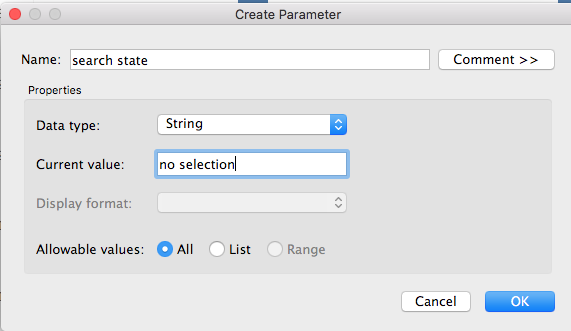
This opens the parameter pop-up window where you select your options for the parameter: Set the Name, Data type, and default value (Current value) for the parameter.
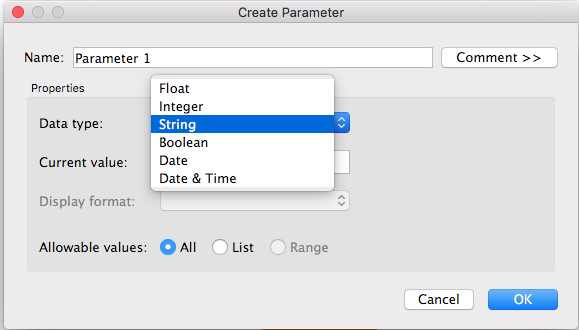
Note: The Display format option is only available in Tableau Desktop.
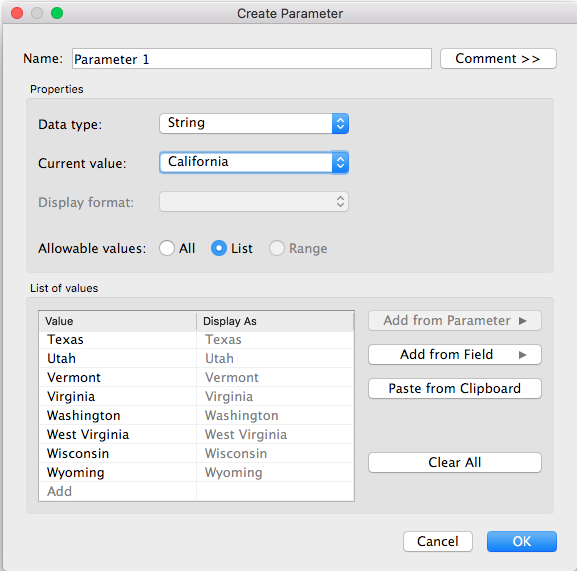
The Allowable value, determined by the data type, can be either All, List, or Range, and these options format your Parameter Control as follow:
- All - the parameter control is a simple type-in field
- List - the parameter control provides a list of values to choose from
- Or Range - the parameter control presents values within a range
For List, you must specify the list of values, which you can add from a field using the option Add from Field.
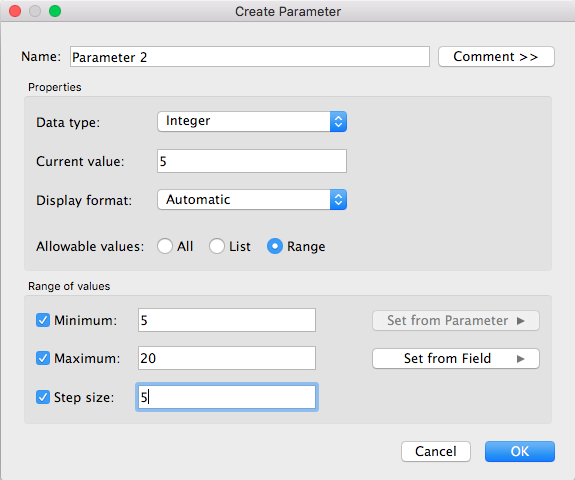
For Range, you must specify the Range of Values (minimum, maximum, and step size) within that range. You can also use the values from a field.
Once you create a parameter, it will appear within a new panel at the bottom of the data pane.
How to Use Parameters
Parameters can not change your visualization unless they are incorporated into a calculation or a filter. Usually, you replace the constant value with the parameter in a calculation, then use the parameter control to dynamically change the threshold in your calculation.
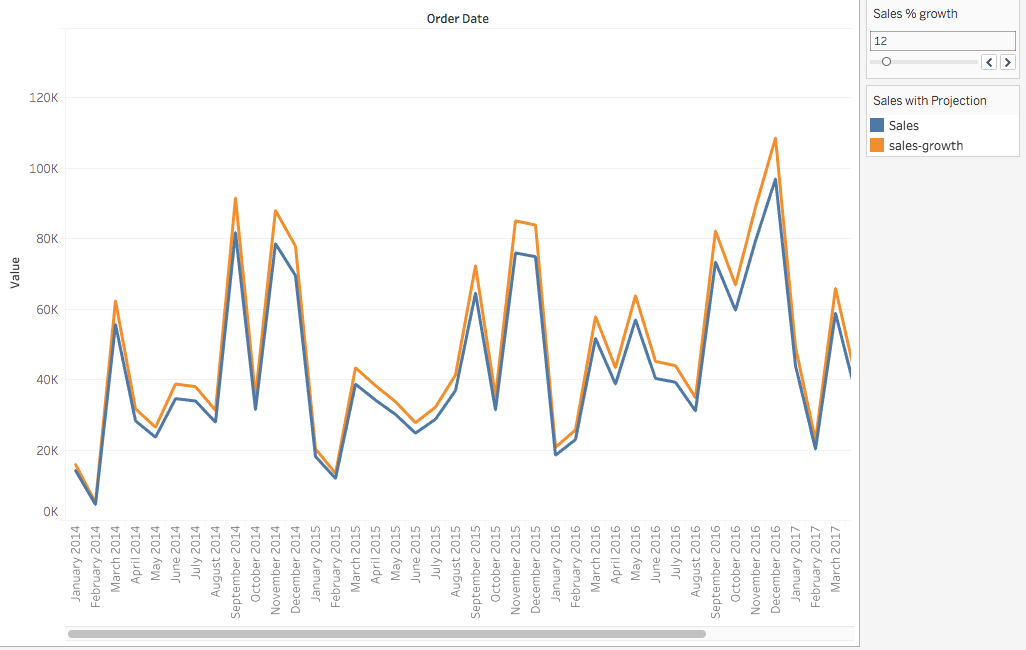
In the example below, we used a parameter “sales-parameter” within a calculated field, then display it in the visualization.
Using Your Parameter in a Calculation
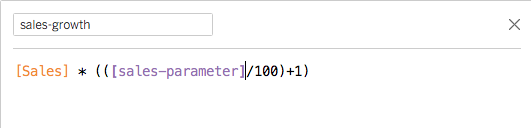
Open your calculated field using right-click > edit calculated field.
Drag the parameter to your formula to replace the constant or part of your formula.
Edit the values of your parameter; it will automatically update your formula.
Using Your Parameter in a Filter
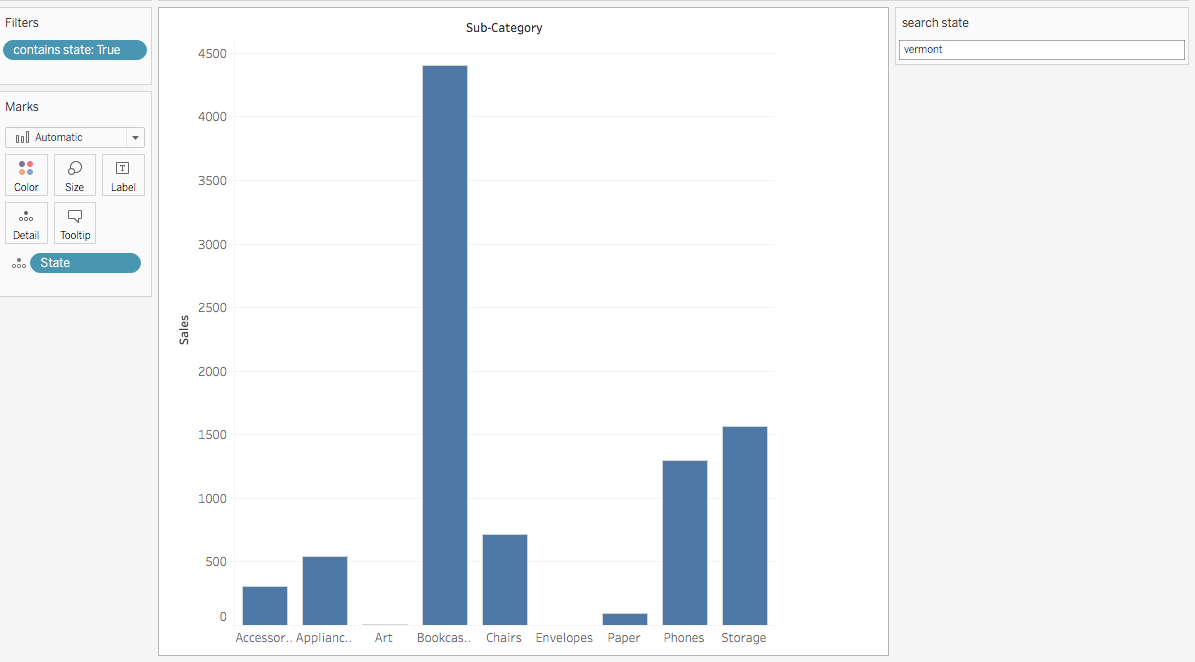
In the above example, we created a parameter to filter by State and display the sales for the selected state in the search state type-in field. We dynamically control the values used in a filter Contains state.
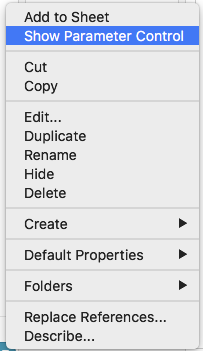
First, create your parameter as below. Then, show the parameter control, right-click the parameter in the Data pane, and select Show Parameter Control.
You create your calculated field in which you control the values using the parameter.
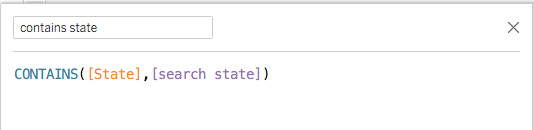
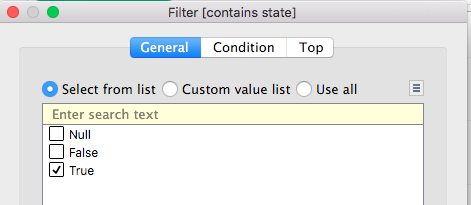
Then drag the calculated field to the filter panel and set the filter.
Using Reference Lines with Parameters
You can use a parameter to dynamically modify a reference line, band, or box. Then use the parameter control to display the reference line at various values point for your parameter. The reference line is drawn at the Current Value specified by the parameter, editing your parameter value will update the position of the reference line.
Parameter Control
You can customize the parameter control and include it in any sheet or dashboard you create. The Parameter control presents similar features to the filter controls.
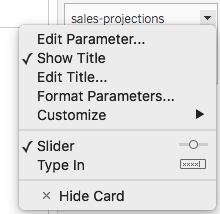
Click on the menu of the parameter to display it.
You will be able to display your control values as radio buttons, a compact list, a slider, or a type-in field. The available options will depend both on the data type, and whether you have selected all, list, or range in your parameter settings.
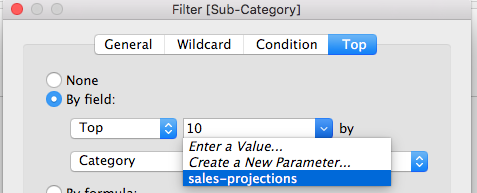
Note: Parameters are set globally and can be used in any of your worksheets. They are also available in the “top” tab in the filter pop-up window.
Any edit to the parameter will update any formula or filter that uses it.
Going Further: Using Parameter Actions
In a future article, we’ll explore actions using parameters. You will see that you can control your parameter values using parameter actions, letting your users change a parameter value through direct interaction with your dashboard. This, for example, such as clicking or selecting a mark. You’ll be able to use parameter actions with reference lines, calculations, filters, and SQL queries, and to customize how you display data in your visualizations.