This post was written by Faycal Bouguir. Faycal is a UX & Data Visualization/Infographics specialist based in NYC. He teaches Data Visualization using Tableau at the Career Centers.
Source: Tableau.com
In the most recent version of Tableau (2020.2), the software introduces Relationships as a new way to combine data for your analysis. We will explain how the new Relationships feature differs from the Join, which is already available in Tableau, and how it affects the rest of your data visualizations process.
What are Relationships in Tableau?
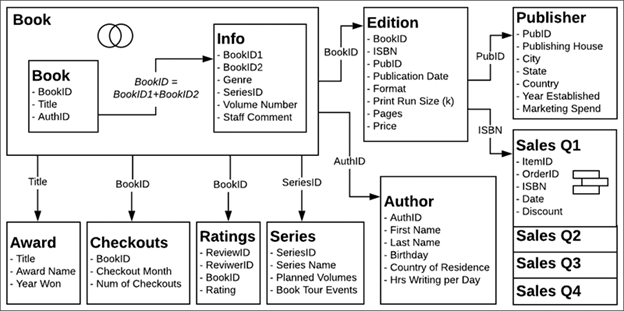
Relationships are a new and more flexible way of combining your data in Tableau. You can create a “relationship” between two or more data tables from multiple sources, and Tableau brings in data from these tables using Relationships to build a data query with the appropriate “Join” between the tables. When you create Relationships, Tableau automatically determines the common field between these tables, the right aggregation, and how to handle nulls.
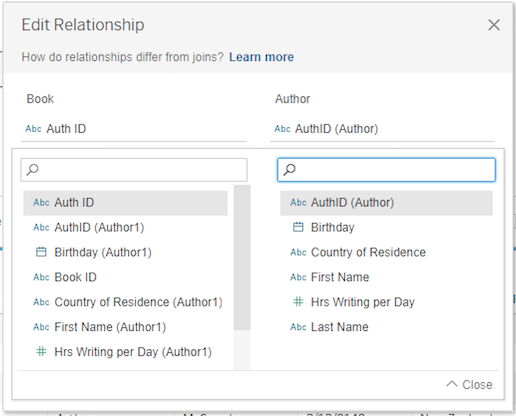
Fig. 1
Tableau follows two types of rules to combine data from multiple related tables:
- Smart Aggregations, which automatically aggregate measures to the level of detail of their source (pre-join) table.
- Contextual Joins, where unmatched values are handled individually based on the current visualization.
Note, you can't define relationships based on calculated fields or geographic fields.
How to proceed
Typically, you would have a dataset with multiple tables that you want to utilize in your data visualization. In this example, I am using the bookshop dataset available from the Tableau website, which you can download here.
After connecting to your dataset, you start by dragging a table to the view (fig. 2) as you would do in previous versions of Tableau. As you bring out a second table (fig. 3), you will see an orange line connecting both tables. Tableau will look for matching fields between both tables.
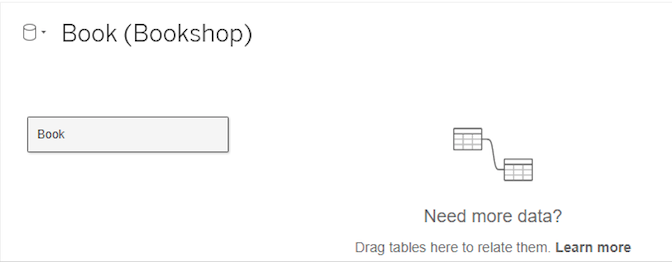
Fig. 2
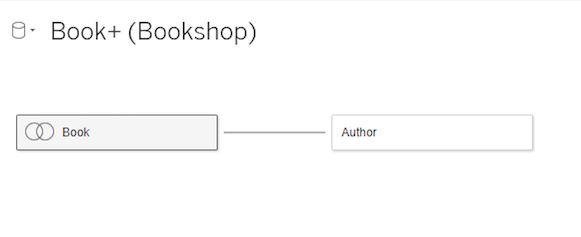
Fig. 3
Relationships can be many-to-many and support full outer joins. You can also create relationships from tables added for different data sources and connections.
If you still wish to create a join, you can still do so (fig. 4). You will have to double click the first table, then drag the second table to the view to create a join. Union and Blend are still available as well, once you double click a table.
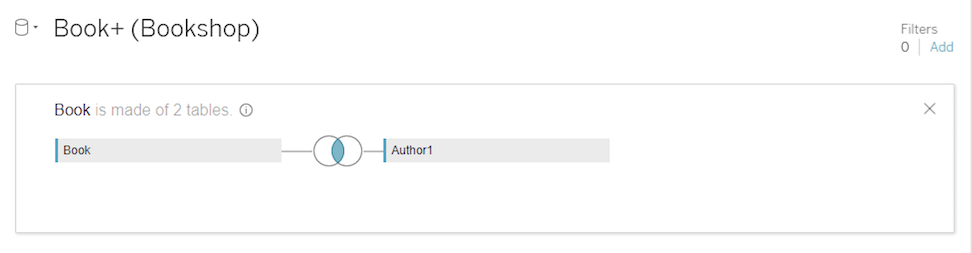
Fig. 4
Differences with previous versions of Tableau
In the new data model, Tables now have two layers: a logical layer where you create relationships between the tables using the noodles that appear in the view, and a physical layer you access when you double click the table in the view, and in which you create Joins and Unions.
Unlike Joins, Relationships don’t merge tables together. Instead, you are creating a relationship between tables that remain separate, yet still allowing you to utilize the data from each table. Relationships don’t require you to select join types either. Tableau automatically creates a relationship based on existing key constraints and matching field names. You can modify the fields you want to use, and add more field pairs to your tables’ Relationships. However, the fields that define the relationships must have the same data type for it to work.
In the sheet tab, there are as well some differences from previous versions
of Tableau (fig. 4):
- Each Table is now displayed with a line that separates dimensions from measures.
In previous versions, you had all dimensions at the top and measure at the bottom
of your data pane.
- Calculations are displayed per table, and when they are requiring fields from multiple tables, they are displayed at the bottom of your data pane.
- Number of Records for the data source has disappeared in this version of Tableau. It is now defined locally as a Count field in which COUNT of table = SUM of Number of Records per table.
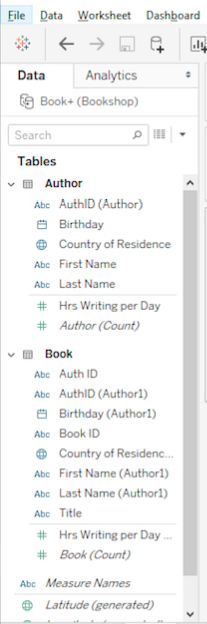
Fig. 5
Advantages of using Relationships
- With relationships, you have less data preparation to do since Tableau automatically combines only the relevant tables at the time of analysis.
- Relationships highlight nuances in your data that were previously easy to overlook, like the level of detail of your measures, or unmatched values across tables.
- A single relationship simultaneously supports all four join types making it easier to work simultaneously on multiple levels of visualizations.
Conclusion
Relationships are Tableau’s new default method to combine and query data. It makes data preparation and analysis easier and has a more intuitive way of handling aggregate.
Unlike Joins which are a more static way to use Tables, Relationships allow you to keep row and column data from related tables potentially available in the data source. These changes facilitate your work in analysis, by creating the appropriate joins automatically, based on the fields in use. Lastly, Relationships can only be equal which means you can only create Relationships between tables with matching fields.