
In this tutorial, we’ll walk through step-by-step how to use Data Tables in Excel with some simple examples.
Data Tables are an extremely useful and advanced feature in Excel. A Data Table shows you the range of effects of one or two different variables on a formula. Say we are thinking about the amount of money we need to invest each year into our savings account so we can one day retire. Maybe we’ll put $1,000 per year or $5,000 a year or some other number. What a Data Table will allow us to do is to easily see the different outcomes of that exercise with each of the different investment amounts.
Exercise #1
-
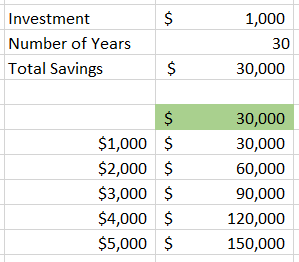
Create a cell for the investment amount and number of years
-
Create a formula for the total savings amount
-
= ‘Investment’ * ‘Number of Years’
-
-
Then make a list of all the different potential investment amounts
-
On top of the second column of your table link to the ‘Total Savings Amount’ formula
-
Highlight the entire range and click Data > What If Analysis > Data Table
-
The Column Input Cell, in this case, is the ‘Investment’ because that is the variable that is impacting our total number
-
Hit Enter and you should see your values populate
-
Exercise #2
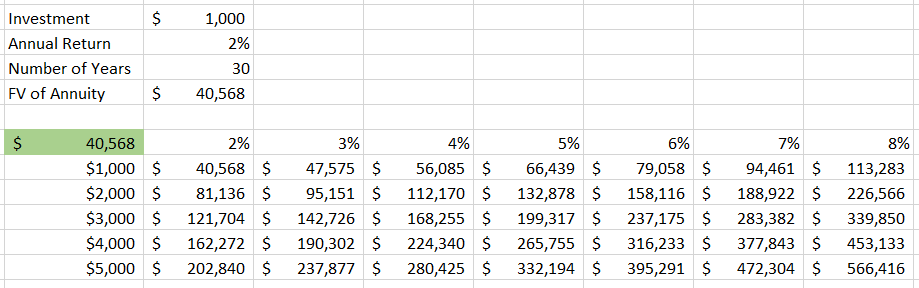
That exercise went through a 1-variable Data Table where we were only changing the investment amount, but in savings or investments, you generally get some sort of return on your investment each year. Our next step is to add the rate of return that we expect to get each year and make this a 2-variable problem. We can set up the 2-variable Data Table as follows:
-
Use your investment amount and number of years from exercise 1
-
Add a new value for the annual return
-
Then make a cell using the future value of annuity formula
-
=Investment*((1+rate)^periods)-1)/rate)
-
-
Now create the table where the values will be filled with rates across one row and investment amounts down one column
-
Then in the top left of your table link to the future value of annuity formula cell
-
Highlight the entire range and click Data > What If Analysis > Data Table
-
The Column Input Cell, in this case, is the ‘Investment’ because that is the variable down the column of our table
-
The Row Input Cell here is the ‘Annual Return’ that is across the row of our table
-
Hit Enter and the values should populate
-
More on Excel
Want to learn more cool features like these and become an Excel wiz? See our course offerings: