


What is Data Analytics?
In this increasingly tech-enabled world, everything from washing machines to doorbells connects to wifi. There has never been a more exciting time to learn about data! According to Forbes, more than 50% of companies are analyzing Big Data (a fancy term for massive datasets).
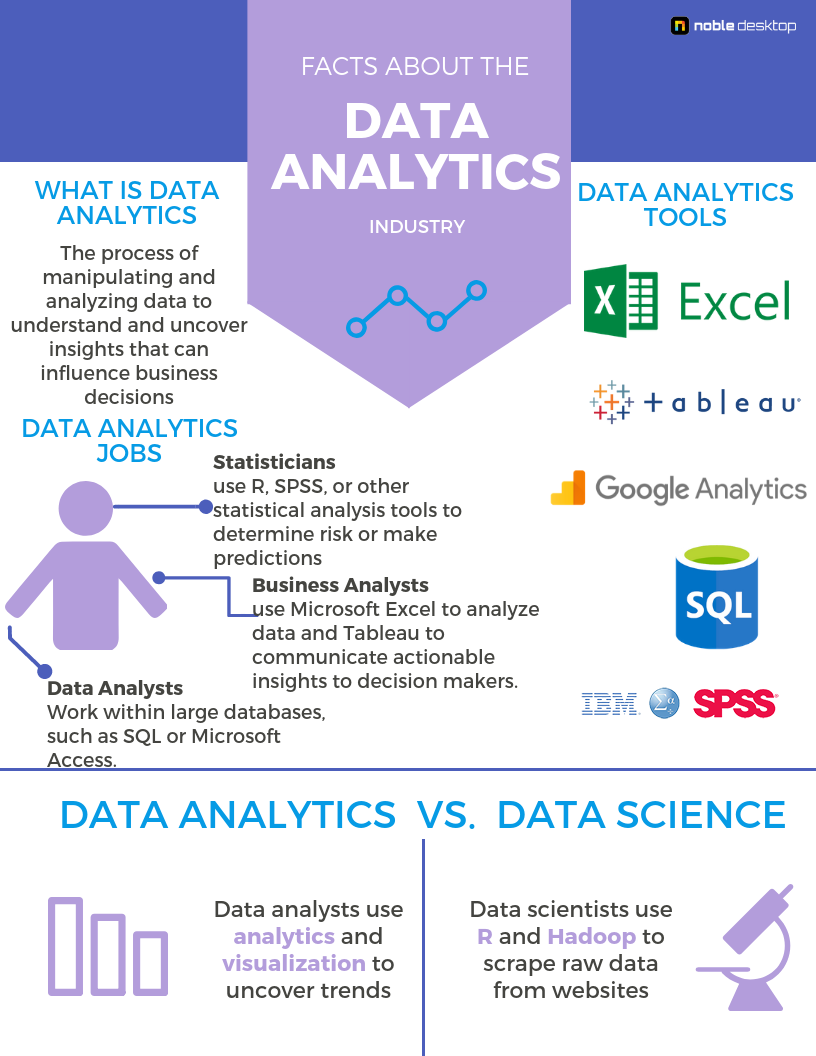
Data Analytics is the process of manipulating and analyzing data to understand and uncover insights that can influence business decisions. Companies use these insights to target and adjust their efforts to reach their target audience. Customer and social analysis are among the primary goals for data analytics in most companies.
Data Analytics vs. Data Science
Like data analytics, data science is also a hot topic but involves an entirely different set of skills and tools. Data science is the study of data, with the focus of using algorithms, mathematics, and techniques to extract useful data from non-traditional data sources. While data analytics relies on readily available data, data science focuses on how to extract this data into a usable form that can be processed and analyzed with data analytics software.
Data scientists use tools like the coding language R and Hadoop framework to “scrape” or extract raw data from a website. In data science programs, students often learn how to “scrape” public websites with lots of raw data, such as Twitter or Google. Examples may include writing an algorithm to produce all results in a web directory or finding all of the records containing a specific word on a public site.
Another way to look at the difference between data science and data analytics is to view data science as preparing data before analysis, and data analytics as reviewing data after the fact. Data scientists are experts in data extraction, cleaning and preparation while data analysts are experts in uncovering trends and actionable insights. Despite being similar in name, data science and data analytics involve entirely different processes, tools, and functions of data.
Data Analytics Jobs
Data analytics jobs fall into different categories depending on your knowledge of programming and statistics. Most data analytics jobs fall within the business analyst role, in which data professionals work with Excel and Tableau. Some may have additional skill in a programming language or other specialized software.
Most data analytics professionals must incorporate data from a variety of tools to form one coherent story. A campaign targeted to customers including website traffic, social media, and other forms of marketing can form three separate data sources. To determine which strategies are most effective and identify new approaches that can lead to even more customer engagement and sales, data analysts often import data into one program.
Business analysts typically use tools, such as Microsoft Excel or another tool to analyze data and Tableau or another visual tool to communicate actionable insights to decision makers. Statisticians take data analytics a step further by using R, SPSS, or other statistical analysis tools to determine risk or make predictions. Other data analysts work within large databases, such as SQL or Microsoft Access.
Data Analytics Tools
Microsoft Excel
Despite being a popular tool that most individuals have on their personal and business computers, very few people harness the complete power of Microsoft Excel. Microsoft Excel is a data analytics powerhouse that offers support at every stage of the data analytics process from cleaning and analyzing data to performing analysis and displaying results in charts and graphs. Its most advanced users write macros (complex instructions that automate computer tasks) using Visual Basic for Applications (VBA), a coding language used to program Excel.
Microsoft Excel can do the following tasks:
- Reformat data
- Use formulas to calculate new values from existing data
- Forecast financials using equations and functions
- Complete math functions and statistical analysis functions like ANOVA and regression
- Display results and analysis using pie, line, and bar charts
Learn more about Microsoft Excel and our courses.
SQL
SQL (whether it’s pronounced ess-que-el or SEQUEL is up for debate) is a coding language used to store, organize, and retrieve data from relational databases. With SQL you can analyze data for an e-commerce store by joining multiple datasets or tables to gain new insights. For example, you can query and merge two datasets, one containing customers and another containing orders to determine all of the customers that bought a specific product and their particular location.
It is important to note that SQL is not a database itself, but rather a command language used to communicate with a relational database, most commonly Microsoft SQL server.
In recent years, programmers have created adaptations of SQL to use with modern object-oriented or non-relational databases. With SQL, you can perform the following tasks:
- Create a database
- Sort and/or filter data within a database
- Query a database to find specific information about a product or user
- Join two different datasets to view information that meets specific criteria
- Convert output data or export it to external applications
Discover our industry-leading SQL courses & bootcamps.
Tableau
Tableau is a powerful tool that allows you to visualize your data analysis. The benefit of Tableau is that non-technical professionals and decision-makers can immediately notice trends and data insights without pouring over detailed reports or data sets. Tableau is useful in any industry with access to data and is a popular tool in both the public and the private sector.
With Tableau, you can do the following:
- Connect raw datasets from almost any program including Microsoft Excel, SQL, Microsoft Access, and SPSS
- Use Tableau Prep® to clean and analyze data for further analysis
- Analyze trends and stories within your data
- Create responsive insights that can be customized by colleagues
- Manipulate interactive charts, graphs, and other representations of data
Get started with data visualization in hands-on Tableau training.
Microsoft Access
Microsoft Access is a database program that is part of the Microsoft Office Suite. It’s a local application, so it’s not available online with other Office 365 products, and it must be downloaded to a desktop computer. It’s considered a user-friendly alternative to SQL Server, particularly for non-technical professionals.
Microsoft Access is an ideal choice for individuals and small teams that need to analyze massive data sets. Excel is limited in its ability to analyze large amounts of data quickly, and access speeds up the process while adding more features including higher data storage capacity and additional security. Use Microsoft Access to do the following:
- Create databases and store new data
- Analyze large data sets over extended periods (ex., five-year, ten-year analysis)
- Easily transfer data between Microsoft applications
- Offer an easy-to-use alternative to server-based databases for non-technical professionals
- Create and publish PDF reports or export data
SPSS
Statistical Package for Social Science (SPSS) is a software program used to perform complex quantitative statistical analysis. The program includes features to clean, recode, analyze, and visualize data characteristics. Data preparation features like recoding data and transforming variables are standard in SPSS but could take hours in Excel.
An essential feature of SPSS is its ability to determine if a particular finding is statistically significant and applicable to larger populations outside of the sample size.
Users can write scripts to automate data analysis or write code in Python to enhance performance capabilities. SPSS is an excellent tool for the following tasks:
- Using advanced data manipulation tools to recode and format data
- Conducting complex data analysis including ANOVA, regression and factor analysis
- Determining the statistical significance of a given result
- Connecting data with other programs
- Creating descriptive graphics to visualize data range and outliers
Data Analytics Training & Certifications
If you’re new to data analytics, it’s best to start with MS Excel classes. Beginner, Intermediate, and Advanced courses teach Excel fundamentals from formulas to pivot tables and functions, or if you’re looking to enhance your resume, our Excel certification program includes classes, private training, and the certification exam at one low price. Topical courses are a good fit if you are using Excel for Financial Modeling.
SQL courses teach you everything you need to know about relational databases from data types, how to query and retrieve data to creating custom views, tables, and indexes. Our advanced course and 3-day bootcamp introduce data storage and temporary tables.
When you’re ready to share results and visualize data, Tableau Level 1 introduces data visualization and basic functions while Tableau Level 2 builds upon data visualization map techniques and guides you through creating custom charts.
Custom and targeted training options include classes dedicated to VBA, Microsoft Access, or SPSS and statistical methods.
Data Analytics Classes in NYC
Data analytics is the process of transforming raw data into useful insights. Data Analysts rely on a range of technologies, tools, programming languages, and software to locate patterns and trends in the data and to use data to solve problems. Those with a background in data analytics play an important role in an organization. They can help improve the efficiency of business processes, help the business grow and expand, increase revenue, and provide insights that can lead to better organizational decision-making.
Why Learn Data Analytics in NYC
As more organizations gather and save data, the need for individuals who can make sense of this information is in high demand. By studying variables like customer buying behavior, social media engagement, and demographics, Data Analysts can have a significant impact on the decisions a company makes. Those who know how to analyze data have a range of professional opportunities in sectors like healthcare, finance, and higher education. In New York City, the current average pay for a Data Analyst is $86,000. The following sections will take a brief look at some data-related job opportunities in NYC, as well as the corresponding salaries.
Marketing Research Analysts
Marketing Research Analysts use platforms like Google Analytics to gather and study marketing data. These professionals must have a background in digital marketing, as well as data science, to perform tasks like analyzing consumer data and studying competitors. Market Research Analysts also explore factors like business conditions and customer preferences to evaluate how a service or product can be expected to sell. They help their organization have a better understanding of the products consumers are looking for, the types of people who will purchase their services or products, and what they will spend to do so. In NYC, Marketing Research Analysts earn approximately $79,000 a year.
Data Engineer
Data Engineers work with datasets to spot anomalies and trends. These professionals also create algorithms capable of manipulating data so additional insights and information can be found in data. They create storage solutions capable of handling vast amounts of data, as well as pipelines through which data travels. To perform their job, Data Engineers draw from a range of technical skills, such as knowledge of data structure and manipulation, as well as Python and SQL programming. Data Engineers who work in NYC earn a competitive salary and make an average of $120,000 annually.
Data Architect
Data Architects are involved with creating designs and blueprints for data storage and management systems. To do so, Data Architects must have a solid understanding of the data analytics process to create viable data structures. These IT professionals study an organization’s data infrastructure, which helps them design future databases, as well as propose and implement solutions that can help their organization better store and manage data right now. As more organizations gather and store their own data, Data Architects are in-demand across industries. These professionals are well-compensated and make an average yearly salary of $160,000 in NYC.
Best Live Data Analytics Classes in NYC
Those who are interested in studying data analytics in the New York City area can explore a range of bootcamps, classes, and certificates from providers in the area.
Tableau Bootcamp - NYIM Training
Tableau Bootcamp provides participants with instruction on how to create and customize data visualizations. Students learn a range of Tableau skills in this 12-hour bootcamp, such as how to filter and structure data, connect to different datasets, and create maps, dashboards, and stories. Bootcamp participants also learn which datasets are best to connect to, as well as how to create different maps to depict geographic data. This program costs $499. All graduates can retake this class for free for up to a year.
Excel for Business Bootcamp - NYIM Training
Those who are interested in learning how to work with Excel for business purposes can enroll in Excel for Business Bootcamp. This 18-hour class starts with spreadsheet basics, such as data entry, core Excel shortcuts, and charts. During three days of intensive training, participants progress into intermediate and advanced skills, such as using VLOOKUP and PivotTables. By graduation, those enrolled will know how to record macros to automate repetitive spreadsheet tasks. Tuition is $549.
Data Analytics Certificate - Noble Desktop
Data Analytics Certificate is a 156-hour certificate program available from Noble Desktop. This rigorous program is geared toward aspiring Data Analysts and Business Analysts. Participants in this program receive hands-on training in a range of data analytics skills, such as performing data analysis, managing databases, and visualizing data findings. Through small class instruction, those enrolled in this certificate complete real-world projects designed to help them learn how to use different tools to collect, wrangle, analyze, and visualize data. They also work with case studies to become familiar with prescriptive and predictive analytics. Tuition is $4,995. This fee includes the option of a free course retake for up to one year, as well as one-on-one mentoring outside the classroom.
Power BI Bootcamp - NYIM Training
Students who are interested in exploring Microsoft Power BI’s data visualization capabilities can do so in NYIM Training’s Power BI Bootcamp. This bootcamp teaches students how to solve data problems efficiently using Power BI. Instruction is provided on connecting to datasets using Power BI’s data model, working with Power Query to query data, and creating engaging visualizations and dashboards with the help of this software’s report view. Learners also become familiar with how to create measures to find COUNT, SUM, and MAX, as well as how to create data visualizations using Power BI’s DAX language. This course takes 12 hours to complete and costs $599.
Data Analytics Technologies Bootcamp - NYC Career Centers
The eight-day Data Analytics Technologies Bootcamp provides intensive training on core data analytics tools like Tableau, SQL, and Excel, which are needed to pursue a career as a Data Analyst. Participants complete real-world projects that teach them to use Excel’s formulas and functions to aggregate and summarize data. Learners also gain experience working with SQL to organize, filter, and summarize the data contained in large databases. By course completion, those enrolled will know how to use Tableau to format data and create data visualizations.This 51-hour program costs $1,949. As a prerequisite, participants should have basic computer skills. Additionally, prior experience working with database management tools is helpful.
Power BI Data Analysts Training Course (PL-300) - Learning Tree International
Learners at all levels can study Microsoft Power BI in Learning Tree International’s Power BI Data Analyst Training Course. Instruction is provided on how to use this program to model, visualize, and analyze data, as well as how to collect and process the data contained in both relational and non-relational databases. Participants in this program also become familiar with implementing policies and security standards. By course completion, students will know how to model data for optimal performance and scalability, create reports and execute advanced report analytics, and share these reports with others. The cost of study is $2,650.
Beginner Microsoft Excel - NYC Career Centers
If you’re just getting started learning how to use Excel’s spreadsheets, Beginner Microsoft Excel offers introductory-level, hands-on instruction. This six-hour class covers a range of basic Excel features, skills, and tools, like how to format workbooks, work with formulas, functions, and charts, and create hotkeys and shortcuts. Participants learn through practical exercises that are designed to impart a spreadsheet concept, provide an example, and allow participants to independently complete an activity to reinforce this concept. The cost of study is $249. This fee includes the option of a free course retake for up to a year.
Data Analytics Boot Camp - Columbia Engineering
Those who are seeking a deep dive into data analytics can enroll in a Data Analytics Bootcamp, which is available from Columbia Engineering. Learners work with a range of data analytics tools, software, and programming languages, such as Python, SQL, JavaScript, HTML5/CSS, Excel, Tableau, and Git/GitHub. In addition, instruction is provided on statistical modeling and forecasting, front end web visualization, business intelligence, and machine learning.
By completing real-world projects in industries like healthcare, finance, and government, participants in this bootcamp prepare to use their data analytics skills in a professional setting. Tuition is $13,495.

