
In this guide, we’ll walk through how to set up a portfolio tracker using Excel. Whether you want to track an existing portfolio, use Excel functions to inform selling, or track stocks on your watchlist to know when/if to buy, you can use Excel’s built-in “Stocks” feature to pull the information you’ll need.
![]()
You can use basic Excel knowledge to create rules, spot trends, and compare stocks with the stock data pulled into Excel.
Step 1: New Workbook & Tickers
Let’s jump into Excel to start tracking stocks and pull in stock data. I’m going to put 5 stocks on the tracker for simplicity and they are going to be: Amazon (AMZN), Google (GOOG), Microsoft (MSFT), Walmart (WMT), and Capital One (COF).
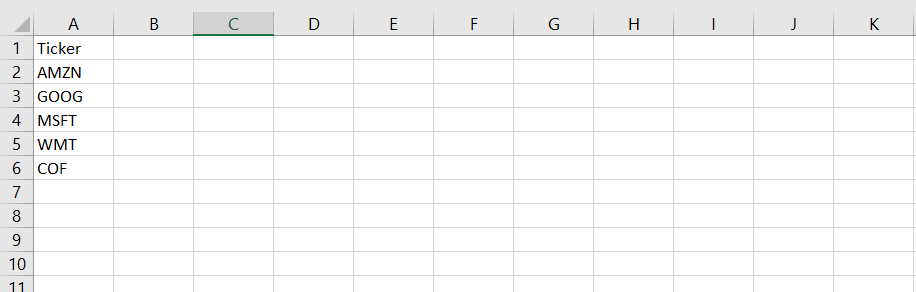
I’ll open up a new workbook or sheet in Excel and start typing in those tickers into my first column and call the column Ticker.
Step 2: Stock Data Types
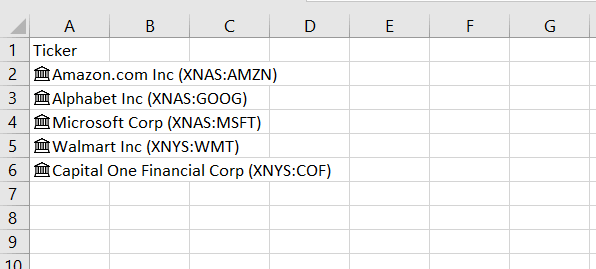
Once I have my stock tickers listed out, I’ll highlight all my tickers and head over to “Data” the toolbar. Once I’m clicked in to “Data,” there is a section called “Data Types,” and within that I see “Stocks.” I’ll go ahead and hit “Stocks” and all those tickers should update with the full name and ticker.
Step 3: Stock Widget
Now those tickers have been transformed into stock data types so you can pull information on them. To start pulling in stock data, you’ll select all the tickers and you’ll see a little widget pop up on the right that you can click on it will give you options of stock data to input.
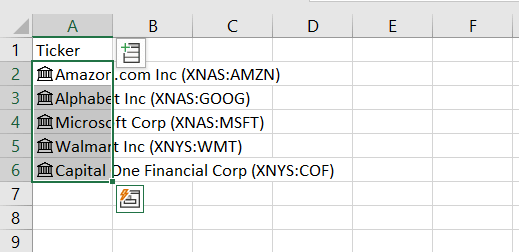
Once you click that widget you’ll have options of what data to pull in and each piece of data you click into will add another column of data.
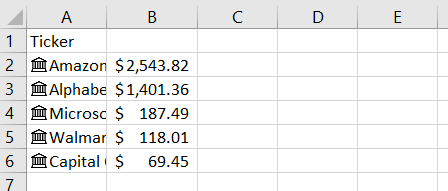
The first thing I’d probably want to know is the price of the stock so I’ll select “Price” and a new column will fill with the prices of each of the stocks.
Step 4: More Stock Info
I’ll go ahead and pull some more information that I think is important for now and then we’ll start using Excel functions to make it more useful. I added the day’s change %, total market cap, 52-week high, 52-week low, P/E ratio, and beta. The P/E ratio measures the price of the stock relative to its earnings/profit. Beta measures a stock's movement relative to the overall market.
With a bit of quick formatting in Excel, here’s what my tracker looks like now:
![]()
Step 5: Personal Investment Info
Now, I want to add in some of my own information if I already own these stocks so I’ll make another column with the number of shares I have and my average price per share paid from my brokerage account.
I can calculate the total amount invested in each stock at the purchase price by multiplying my avg price paid by the number of shares I bought (Column I * Column J).
Then multiplying the current price by the number of share I own I can calculate my current total equity in each stock (Column B * Column I).
Next, I can calculate my total return on each of those stocks by subtracting the investment amount from the current equity value. I could also add some conditional formatting here to highlight gains and losses either using a color scale or cell rules for >0 or <0 returns.
![]()
Step 6: Rules for Sell/Hold
Let’s say I want to hold these stocks for a while or up until a certain stock price I could input my own price target and create logic to tell me when to sell the stock. Once I have my price target, I’ll create another column called “Sell/Hold” that will be my decision column and have the formula =IF(Current Price > Target, “SELL”, “HOLD”) and do a quick conditional formatting for easy visualization.
![]()
Step 7: Aggregating Returns & Equity
One more thing I might want to do is aggregate all my information with a summary row and I can do this by summing up a couple of my columns like Investment, Current Equity, and Return.
Now I have my final Excel tracker that should update on its own as things change. You can also hit “Refresh All” in the Data part of the toolbar to force a refresh of the data.
![]()
If you'd follow thus far, you now have a solid portfolio tracker in Excel and can continue to add information, add stocks, and leverage Excel to inform your stock picks.
If you'd like to learn more about investing so you can make more informed decisions, see our investing classes or finance classes. If you'd like to learn Excel so you can do things like this and more, see our Excel classes.
Note: This is only for information purposes and not meant to be taken as financial advice.