
See here for Stock Tracker Template (make a copy of the template to create your own)
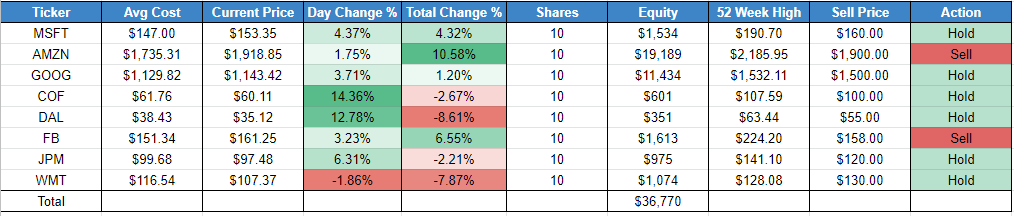
The Columns
-
Ticker: This column will contain the stock ticker symbol for each stock in our portfolio.
-
Avg. Cost: The average cost per share that we purchased each of our stocks at.
-
Current Price: Price data returned by GOOGLEFINANCE. Quotes can be delayed by up to 20 minutes, and support varies by exchange and instrument.
-
Day Change %: Percentage change from previous day's close
-
Total Change %: The percentage price change relative to average cost. This simple measure excludes dividends, fees, taxes, and realized gains or losses.
-
Shares: The number of shares we have of each stock
-
Equity: The total equity (investment or ownership) in dollars that we have in each stock
-
52 Week High: The highest the stock price has been in the past 52 weeks
-
Sell Price: Our personal choice of the price we would be willing to sell our shares at for each stock
-
Action: A flag showing whether the reported price exceeds your chosen threshold. The original template labels the results Sell and Hold; those labels describe the formula's test, not an investment recommendation.
The Formulas
The formulas below are a separate row-2 example using the column order listed above: ticker in A, average cost in B, price in C, shares in F, and target price in I. Adjust the cell references to your copy of the template. Use an exchange-qualified ticker where available, such as NASDAQ:MSFT.
-
Current Price:
=GOOGLEFINANCE(A2,"price") -
Day Change %:
=GOOGLEFINANCE(A2,"changepct") -
Price change from average cost:
=C2/B2-1. The average cost must be nonzero.-
You can use conditional formatting here to get a visual representation of the scale of your gains and losses relative to one another
-
-
Current position value:
=F2*C2 -
52 Week High:
=GOOGLEFINANCE(A2,"high52") -
Target flag:
=IF(C2>I2,"Above target","At or below target")-
Use conditional formatting to distinguish Above target from At or below target in this example.
-
If you want to learn to do this in Excel check out our Excel Stock Portfolio Guide.
Note: This is only for information purposes and not meant to be taken as financial advice.
Learn more about stock market investing, Excel, and finance in our related courses: