
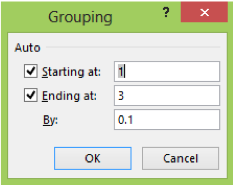
Excel Pivot Tables allow the user to group certain fields such as dates or values. Dates can be grouped by weeks, months, quarters or years. Values can be grouped by any interval.
Grouping Dates in Pivot Tables
Say we have data in Excel for a bunch of class signups with the date of the signup, the name of the class, and the price. As a good analyst that we are, we decide to make a Pivot Table in order to identify some trends and calculate our revenues. We create our table with our command + T shortcut and then we summarize as a Pivot Table. We move our dates to rows and our classes to columns and revenues to values. The data shows revenue totals for each class by date which is very helpful, but having every date is a bit more data than we want - we'd prefer to have it monthly. See below for instructions on how to group data in a Pivot Table.
To Group Data
1. Click on the Field in the Pivot Table
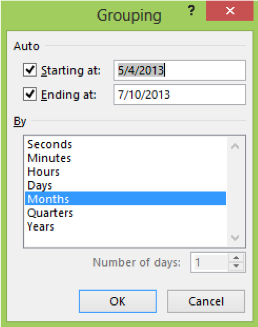
2. Pivot Table Tools >> Analyze >> Group group
Learn More About Excel
Master Excel through our Microsoft Office courses and Excel training in NYC. See our other location pages: