
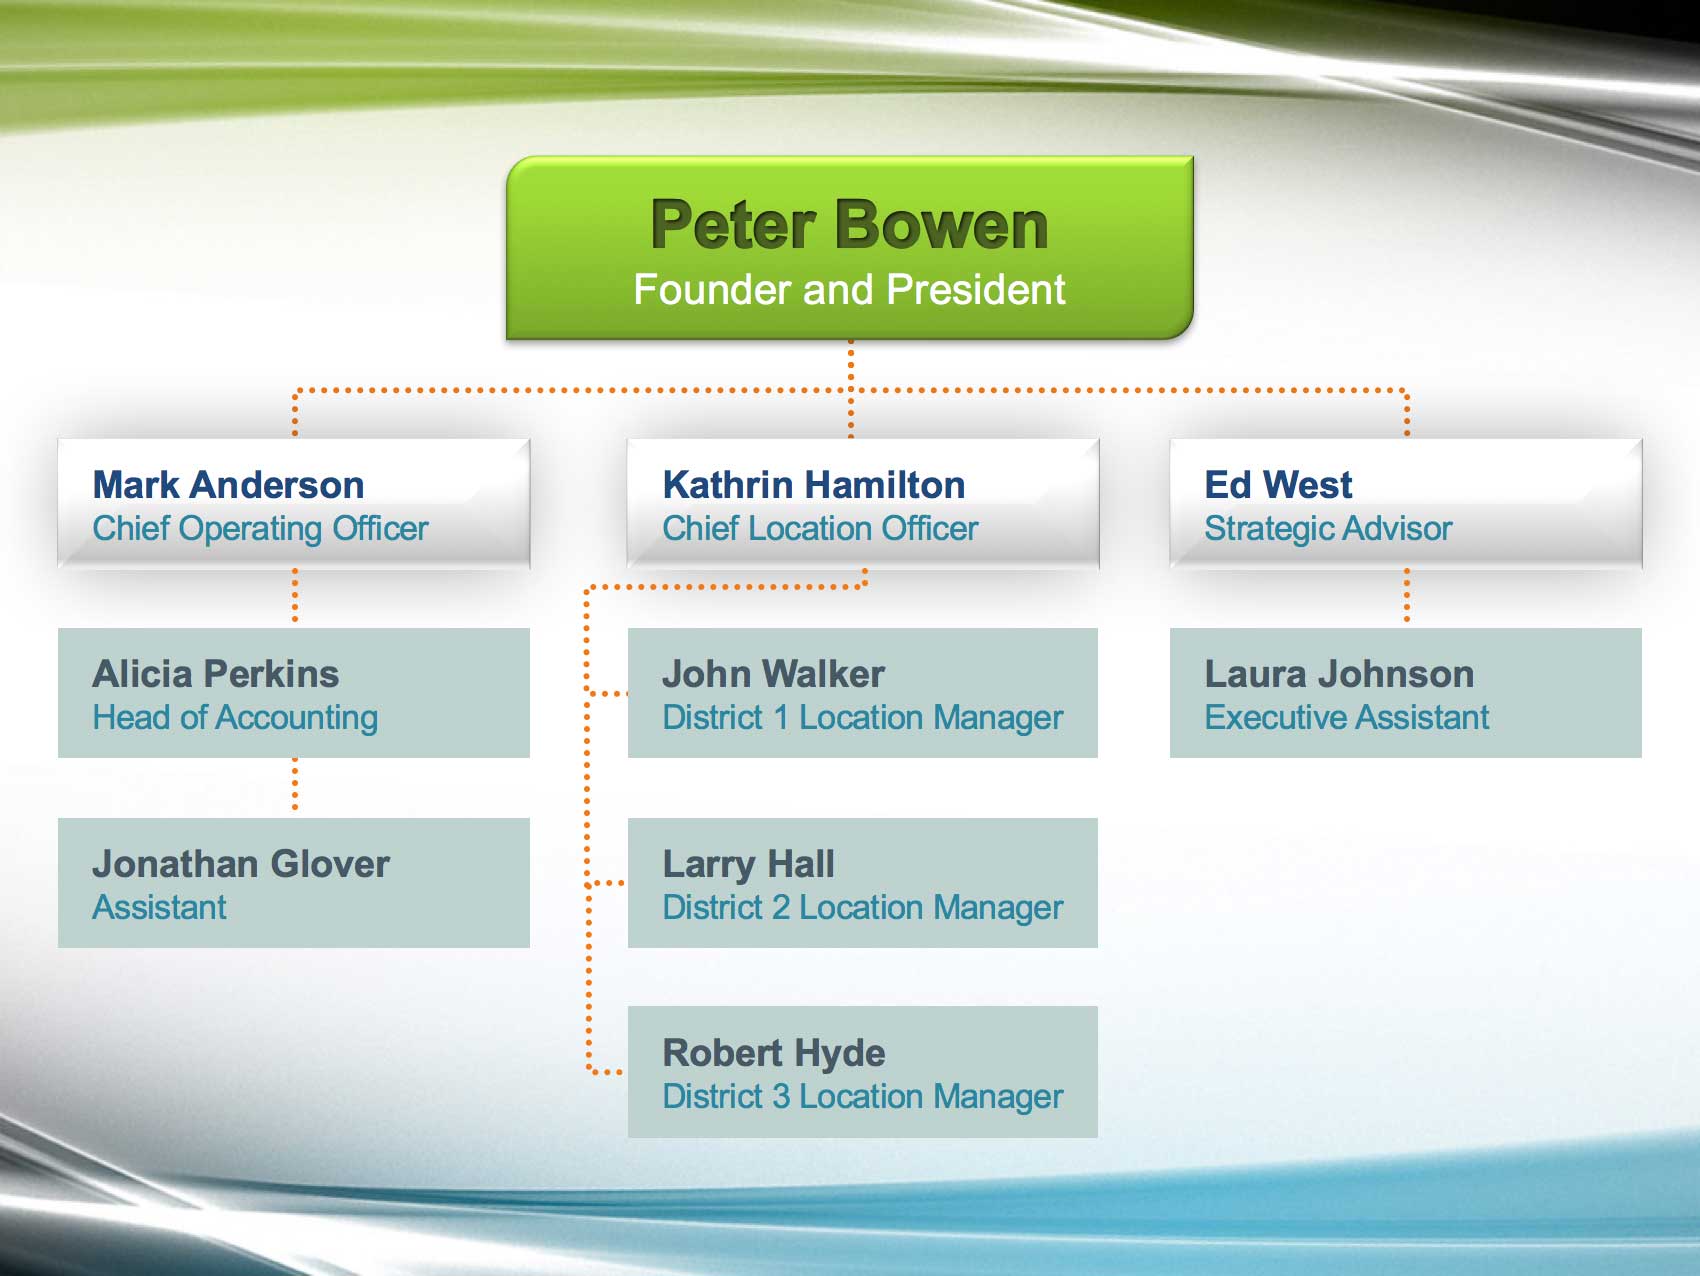
In this exercise, you will create a chart that illustrates Leaf Works' executive employee hierarchy. You'll learn many powerful tricks, such as how to use elbow connectors to easily connect multiple shapes, how to make bold text even bolder, how to get the perfect timing on multiple animation effects, and more.
Getting Started
1. If you have any presentations open, in PowerPoint, go to File > Close to close them. You may have to close more than one.
2. Still in PowerPoint, go to File > Open to open the next project.
3. Under Open, click on On my Mac or This PC.
4. Navigate to the Desktop > Class Files > yourname-PowerPoint 2016 Class folder.
5. Double-click Hierarchical Chart.pptx to open it.
Adding the First Level of the Hierarchy
As mentioned earlier, the presenter may or may not wish to present some slides during their presentation. The hierarchical chart slide we'll make isn't essential, so let's add it to the Appendix, where slides that may not be presented belong.
1. At the very bottom of the Slides list, below any other slides, click on an area at the bottom of the Appendix section.
2. In the Home tab, click the arrow part of the New Slide button and select Blank.
Let's add a shape that has a style we've used already. (As mentioned before, it's a good idea to reuse shape styles to give your presentation a consistent look.)
3. In the Slides list, click on the Peter Bowen contact slide (Slide 19) to open it.
4. Let's make sure that the gray/white gradient rectangle shape is our default shape. Right-click on the large rectangle and select Set as Default Shape.
5. In the Slides list, go back to the blank slide in the Appendix section.
6. In the Insert tab, click the Shapes button and under Rectangles, select the Round Diagonal Corner Rectangle (the last rectangle shape).
7. Click on the slide to make a default rectangle (a square). Notice that unlike previously, the gray and white gradient has been applied. Neat!
8. Right-click on the rectangle and select Size and Position.
9. Set Height to 1.08" and Width to 4.04".
10. Under Position, set Vertical position to 0.92". (You will center it later.)
11. With the rectangle still selected, in the (Shape) Format tab, click the Align button and select Align Center.
The colors in the gradient are too dull for the top of the hierarchy. The gradient will come in handy later, but for this shape, let's reuse a Quick Style effect.
12. In the Home tab, click the Quick Styles button and choose Intense Effect - Lime, Accent 1 (the lime green option in the bottom row). Nice vibrant color!
Getting the Reference Material
Next, we need to add text to this shape (and the shapes we'll create soon). The executives' names and titles were provided to us. Let's grab that content and add it to the side of our slide so we have a reference to look at while working.
1. Go to File > Open to open the project we'll reference.
2. Under Open, click on On my Mac or This PC.
3. Navigate to the Desktop > Class Files > yourname-PowerPoint 2016 Class folder.
4. Double-click Appendix.pptx to open it.
5. In the Slides list on the left, click on the Organizational Diagram slide (Slide 2) to open it.
6. Click into the text box that starts with the text Peter Bowen.
7. Select all.
8. Copy it.
9. We're done with Appendix.pptx, so close it. You should be back in Hierarchical Chart.pptx.
10. Click on a blank area of the slide to deselect everything.
11. Paste the text box onto the slide. We want to reference it when typing into our shapes, but it's going to be in our way unless we move it aside.
12. Drag the text box by its bounding box so that it is completely off the slide in the light gray area (this area of the slide will not show up during the presentation).
NOTE: If you can't see enough of the gray area to move the text box, Zoom Out until you can see it.
Formatting the Peter Bowen Text
1. In the reference text box on the right of the slide, highlight all of the text from Peter to President.
2. Copy it.
3. On the slide, click on the lime green rectangle's bounding box to select it.
4. Paste the text into the shape.
5. If you had to zoom out earlier, at the bottom right of the window, click Fit slide to current window to get a better view of the slide as we edit the text.
6. Let's format the text so it has more impact and matches our presentation. Make sure that the cursor is still blinking in the text, then select all.
7. In the Home tab, set the font to Arial.
8. In the text box, highlight the comma ( , ) AND the space after Bowen.
9. Press Return/Enter to put Peter Bowen's title under his name. The text should now be:
Peter Bowen
Founder and President
10. Click on the bounding box of the Peter Bowen text.
11. In the Home tab, click the Center button.
12. Highlight the words Peter Bowen and in the Home tab, format it as follows:
- Font Size: 28 pt
- Font Weight: Bold
- Font Color: Lime, Accent 1, Darker 50% (last swatch under the fifth theme color, Lime)
13. In the (Shape) Format tab, click the Text Effects button to reveal a menu.
14. Go to Shadow and under Inner, select the first option (Inside Diagonal Top Left (Mac) or Inside: Top Left (Windows)). This added a subtle shadow. If you don't see it, temporarily Zoom In before pressing Fit slide to current window.
How to Make Bold Text Look Even Bolder
We want the Peter Bowen text to stand out even more, but we can't bold it any more than we already have. There's a quick and dirty solution though!
1. Make sure the words Peter Bowen are still highlighted.
2. In the (Shape) Format tab, click the arrow part of the Text Outline button and in the bottom row, select the darkest version of the fifth theme color: Lime, Accent 1, Darker 50%.
3. Let's go one step further. In the (Shape) Format tab, click the Text Effects button and go to Shadow > Shadow Options (at the bottom of the menu).
4. On the right, set Transparency to 20%. Lowering the transparency made the black shadow appear darker. Nice!
Adding the Second Level of the Hierarchy
1. In the Insert tab, click the Shapes button and click the Rectangle.
2. Click on the slide to create a default rectangle (a square). This time, we'll keep the gray and white gradient that we specified as the default shape style earlier.
3. Right-click on the gray/white gradient square and select Size and Position.
4. Set Height to 0.77" and Width to 2.77".
5. Set Horizontal position to 0.57" and Vertical position to 2.58".
6. In the light gray area to the side of the slide, in the text box we've been pulling content from, select the text Mark Anderson, Chief Operating Officer.
7. Copy it.
8. Click on the gray/white gradient rectangle's bounding box.
9. Paste the text into the rectangle.
10. Click once on the text, select all, and in the Home tab, set:
- Font Color: Dark Blue, Text 2 (fourth theme color)
- Font: Arial
- Font Size: 14 pt
11. The text you copied over had an indentation, so let's remove it now. First, make sure you can see the ruler. In the View tab, make sure that Ruler is checked on.
12. Above the slide, in the ruler, click on the bottommost part of the notch (as shown below) and drag it from the1/2" mark to the zero mark:

13. Now on to styling the text. Highlight the comma ( , ) and the space after it.
14. Press Return/Enter to replace it with a new line, so that the text now reads:
Mark Anderson
Chief Operating Officer
15. Highlight the words Mark Anderson in the text box and in the Home tab, click the Bold button to emphasize the name.
16. Highlight the words Chief Operating Officer and in the Home tab, set:
- Font Size: 12 pt
- Font Color: Turquoise, Accent 2 (sixth theme color)
17. Let's add more margin to the text box. Right-click on the gray/white gradient rectangle and select Format Shape.
18. Click on Text Options then click the Textbox button.
19. Under Text Box, set both Left and Right margin to 0.2".
20. With the gradient rectangle selected, press Cmd-D (Mac) or Ctrl-D (Windows) twice to create two copies.
21. With the help of the alignment guides, drag the two duplicates so that they align in a horizontal line to the right of the original rectangle. Your slide should look like this:

22. To add a bit more impact, let's make all the font sizes in the second level of the hierarchy a little bit bigger than they are. First, select all three rectangles (click on one, then Shift-click the others).
23. In the Home tab, click the Increase Font Size button.
24. Let's distribute the objects evenly across the page. In the (Shape) Format tab, click the Align button and choose Align to Slide.
25. Click the Align button again and choose Distribute Horizontally.
26. In the second gradient rectangle, highlight only the words Mark Anderson and type Kathrin Hamilton in its place.
27. On the line below, replace the word Operating with: Location
NOTE: This new text comes from the text box in the light gray area that doesn't show when presenting. Feel free to refer to it as you work.
28. In the third gradient rectangle, highlight the Mark Anderson text. Type Ed West in its place.
29. Highlight the Chief Operating Officer text and replace it with: Strategic Advisor
30. Deselect all by clicking on a blank area of the slide. Nice work so far!
Adding the Final Level of the Hierarchy
1. Hold Option (Mac) or Ctrl (Windows) and drag the Mark Anderson gradient rectangle down, leaving a little bit of space between the duplicate and the original rectangle.
2. We need to replace the name in the new text box. Highlight Mark Anderson and replace his name with the name of his inferior, Alicia Perkins
3. In the same rectangle, replace the entire job title with: Head of Accounting
We need to differentiate Alicia's level from that of her superiors. We want the shapes in the final level to have a plain fill color, not a nifty effect or a gradient.
4. To quickly override all the formatting, in the Home tab, click the Quick Styles button and select the first option: Colored Outline - Blue-Gray, Dark 1.
5. With the shape still selected, in the Home tab, click the arrow part of the Shape Outline button and select No Outline to remove the border.
6. Click the arrow part of the Shape Fill button and under the seventh theme color, in the fourth row, select Green, Accent 3, Lighter 40%.
7. Highlight the words Alicia Perkins to select her name and set the Font Color to the second theme color, Blue-Gray, Text 1.
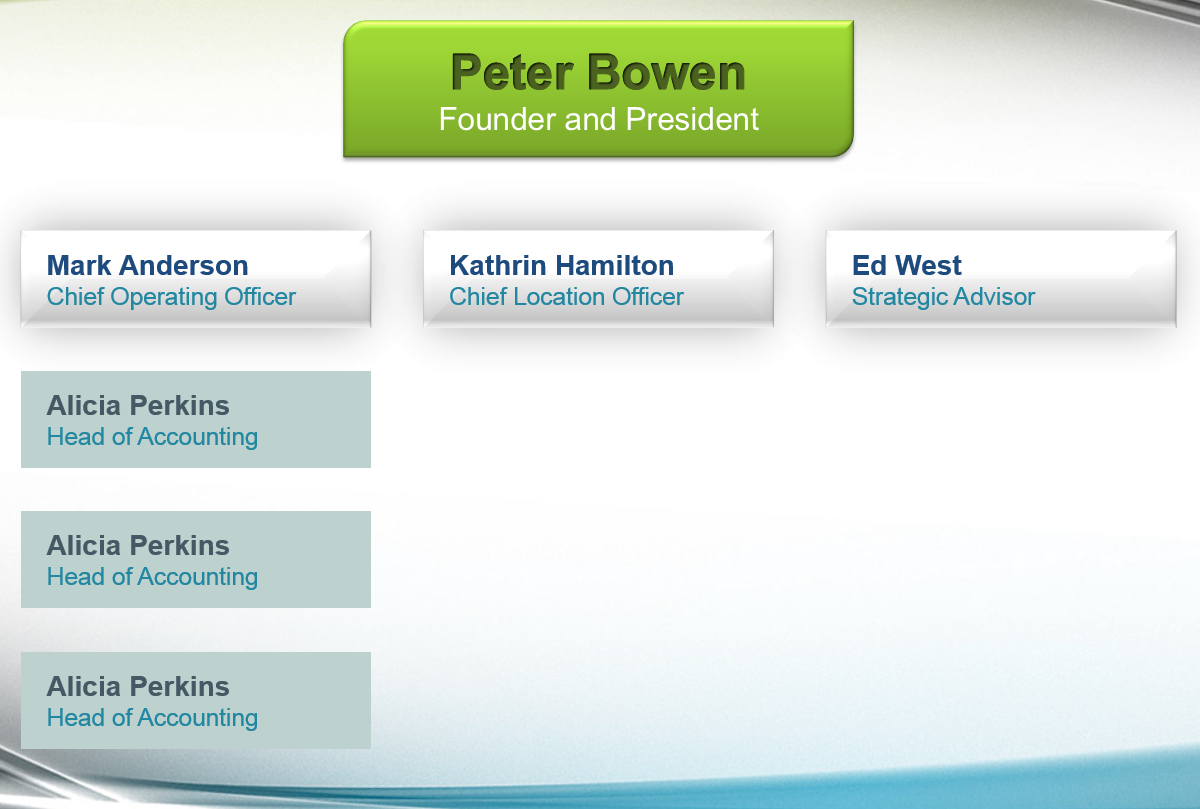
8. Hold Option (Mac) or Ctrl (Windows) and drag out two copies of the Alicia Perkins rectangle directly below it, so you have:
9. Drag a selection box around the Mark Anderson rectangle and the three Alicia Perkins rectangles beneath it to select all four rectangles.
10. Let's distribute the objects equally so they have the same amount of spacing between them. In the (Shape) Format tab, click the Align button and choose Align Selected Objects.
11. Click the Align button again and choose Distribute Vertically.
12. When creating hierarchical charts like this one, it's a good idea to create lots of placeholder shapes, and then at the end, remove the ones you don't need. Let's do just that. Drag a selection box around the three Alicia Perkins rectangles.
13. Hold Option (Mac) or Ctrl (Windows) and drag to the right underneath the Kathrin Hamilton rectangle until a dashed alignment guide appears tangent to the left of the selection (or it snaps in that place).
14. Make sure that only the three newest Alicia Perkins rectangles are selected.
15. Hold Option (Mac) or Ctrl (Windows) and drag them to the right so they align underneath the Ed West rectangle. Make sure there are nine Alicia Perkins text boxes before moving on.
16. Let's delete the text boxes we don't need. Look in the text box in the light gray area that doesn't show when presenting.
There are three people working under Kathrin Hamilton, so we don't need to delete any of those. We do need to delete some shapes in the other columns.
17. Two people work under Mark Anderson, so we need to delete one rectangle. Click on the bottommost rectangle under Mark Anderson and press Delete/Backspace.
18. Ed West only has one person working under him, so drag a selection box around the two bottommost rectangles underneath the Ed West rectangle.
19. Press Delete/Backspace to delete them.
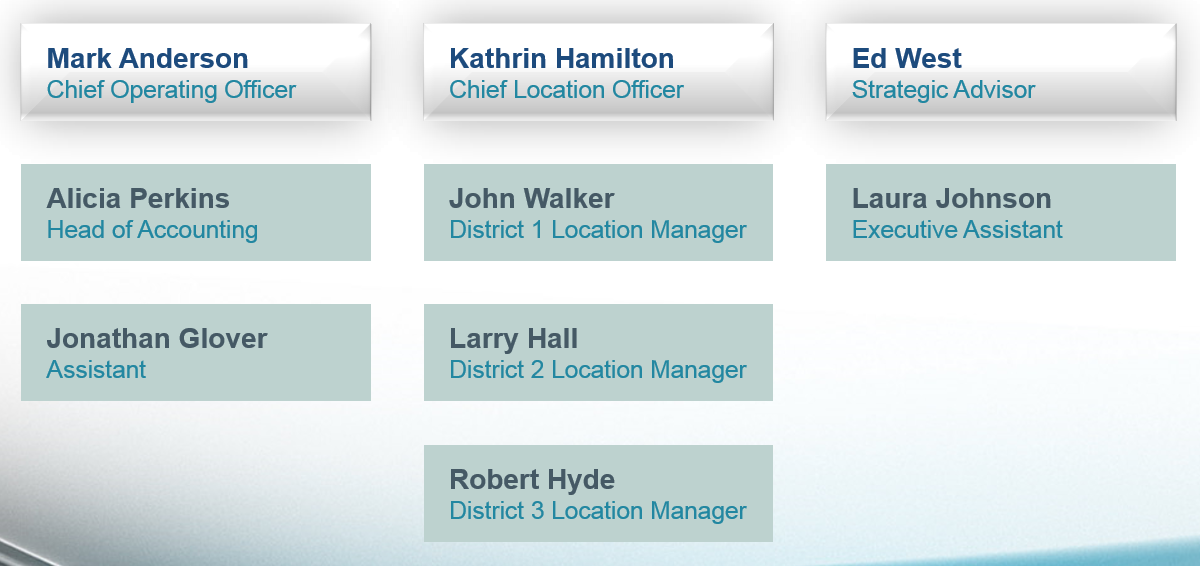
20. As you've anticipated, it's time to fill in the names and titles. Copy from the text box located on the side and paste to the correct respective rectangle (choose the Keep Text Only option. In the end, your slide should look like this:
21. While the text box on the side of the slide won't show in the presentation, it's a good idea to clean up unneeded content. Delete it.
Using Elbow Connectors & Lines to Connect Shapes
1. In the Insert tab, click the Shapes button and then under Lines, select the Elbow Connector (fourth option from the left).
2. Hover with this tool over any of the shapes, and notice that black dots (Mac) or gray dots (Windows) appear at the center point of all the shapes' edges. They mark the places where the elbow connector can snap into.
3. Hover over the lime green Peter Bowen shape, then drag from slightly above the bottom dot to the Mark Anderson shape's top dot (which is gray on both platforms).
Both ends of the line are green dots, which shows that it's connected to a shape.
4. Let's see what happens when one end of the elbow connector is not connected to a shape. Disconnect one of the ends by dragging it so it isn't attached to a shape.
5. Notice that the end has a white square (Mac) or white dot (Windows). This indicates the end that is disconnected from a shape. Drag the same end to reconnect it.
6. With the elbow connector still selected, in the Home tab, click the arrow part of the Shape Outline button and go to Weight > 2.25pt. Our dotted orange line is now easier to see!
7. Press Cmd-D (Mac) or Ctrl-D (Windows) to duplicate the elbow connector.
8. Drag one end of the connector to the bottom of the Peter Bowen rectangle, such that a gray dot appears. (Do not release the mouse until you see the dot!)
9. Drag the other end to the top of the Ed West rectangle until it snaps in place.
10. Press Cmd-D (Mac) or Ctrl-D (Windows) to duplicate the elbow connector again.
11. Drag one end of the connector to the bottom of the Peter Bowen rectangle.
12. Drag the other end to the top of the Kathrin Hamilton rectangle.
13. Hmm, this elbow connector overlaps awkwardly because the Kathrin Hamilton rectangle and the Peter Bowen rectangle are not center-aligned. Let's try something else that allows us to draw a straight line. With the elbow connector between Peter Bowen and Kathrin Hamilton selected, press Delete/Backspace.
14. In the Insert tab, click the Shapes button, then click the Line shape.
15. Drag a line from the bottom of the Peter Bowen rectangle to the top of the Kathrin Hamilton one, so that it aligns with the elbow connectors already there. Make sure there are green dots on both ends before continuing on.
NOTE: If you need to slightly adjust the lines, use the Arrow keys on your keyboard for better precision.
16. Solid. Now let's style this line. Select the elbow connector between Peter Bowen and Mark Anderson (it looks thicker than the line we just drew).
17. There's a keyboard shortcut for copying and pasting styles between lines, shapes, and even text! Press Cmd-Shift-C (Mac) or Ctrl-Shift-C (Windows) to copy this format.
NOTE: This shortcut triggers the Format Painter that works similarly to the Animation Painter. As you did in a previous exercise, you can also press its button on the far left of the Home tab to trigger it.
18. Select the line between Peter Bowen and Kathrin Hamilton, and press Cmd-Shift-V (Mac) or Ctrl-Shift-V (Windows) to paste the format.
19. It's time to connect everyone on the second level of the hierarchy to the bottom level. Select the straight line, if it isn't already selected.
20. Press Cmd-D (Mac) or Ctrl-D (Windows) to duplicate it.
21. Connect one end of the line to the bottom of Mark Anderson's rectangle.
22. Connect the other end to the top of Alicia's rectangle.
23. To connect the Alicia Perkins rectangle to the Jonathan Glover rectangle:
- Select a straight line (e.g., the one from Mark to Alicia).
- Press Cmd-D (Mac) or Ctrl-D (Windows) to duplicate it.
- Connect one end of the line to the bottom of the Alicia Perkins rectangle.
- Connect the other end to the top of the Jonathan Glover rectangle.
24. To connect the Ed West rectangle to the Laura Johnson rectangle:
- Select a straight line (e.g., the one from Mark to Alicia).
- Press Cmd-D (Mac) or Ctrl-D (Windows) to duplicate it.
- Connect one end of the line to the bottom of the Ed West rectangle.
- Connect the other end to the top of the Laura Johnson rectangle.
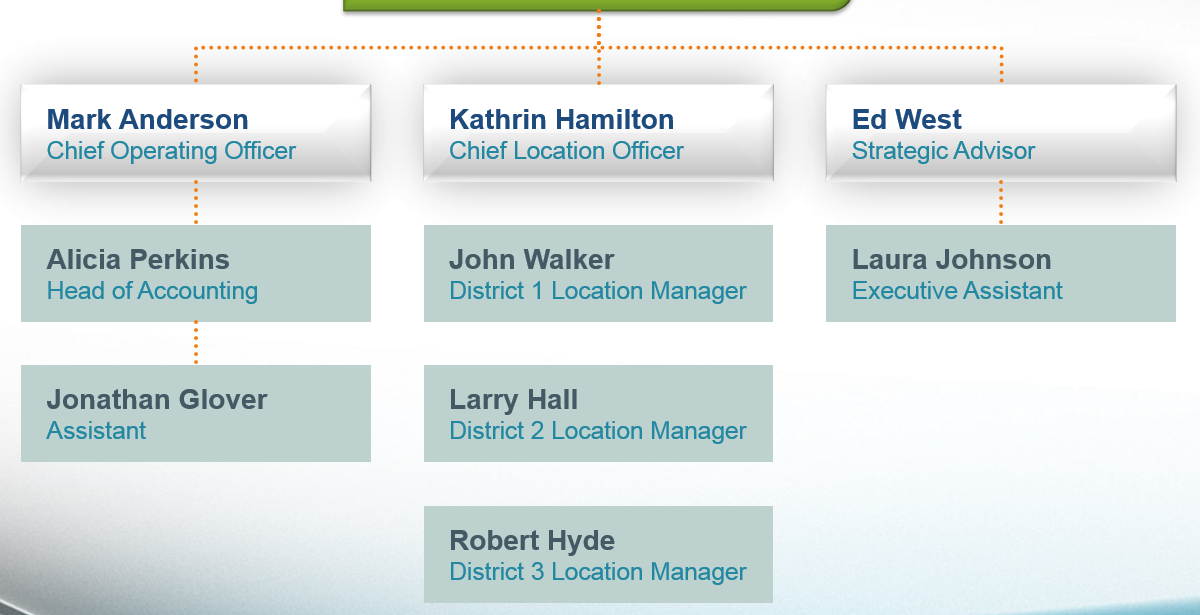
25. Make sure your slide looks like the screenshot below, then save the file.
Connecting Multiple Peers to a Superior
The three location managers under Kathrin Hamilton have the same rank. Larry doesn't have a lower position than John, etc. To connect Kathrin Hamilton to all three of her inferiors, we need to use both elbow connectors and lines.
1. Select the line connecting Ed West and Laura Johnson and press Cmd-D (Mac) or Ctrl-D (Windows).
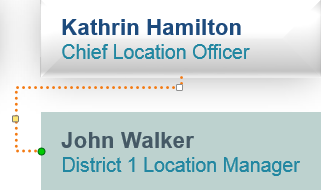
2. Drag the duplicate so that it's connecting Kathrin Hamilton and John Walker.
3. Right-click on the line and select Size and Position.
4. Set its Height to 0.1", and the bottom of the line should shrink. (If the top part isn't already touching the bottom of the Kathrin Hamilton text box, drag it so it is.)
5. Click on an elbow connector, like the one connecting Mark Anderson and Peter Bowen. Press Cmd-D (Mac) or Ctrl-D (Windows) to duplicate it.
6. As shown, connect one end to the bottom of the mini line we just created, then connect the connector's other end to the gray dot on the John Walker box:
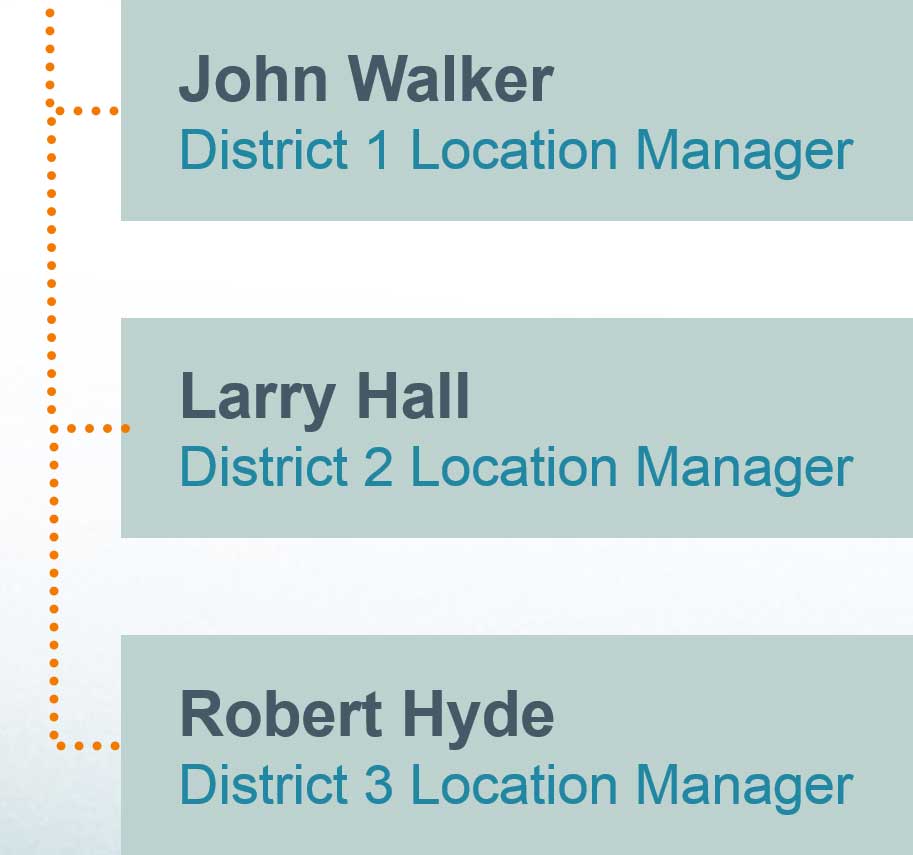
7. Press Cmd-D (Mac) or Ctrl-D (Windows) to duplicate the elbow connector.
8. Drag one end to the left gray dot on the Larry Hall text box. Drag the other end to the left gray dot on the Robert Hyde text box.
9. Click on the straight line connecting Peter Bowen and Kathrin Hamilton.
10. Press Cmd-D (Mac) or Ctrl-D (Windows) to duplicate the line.
11. Drag the duplicate to the empty area between John Walker and Larry Hall.
12. Hold Shift and drag or use the Arrow keys on your keyboard to nudge the duplicate line into place until your slide looks like below (you may need to resize the line):
13. Deselect all by clicking on a blank area of the slide.
14. We want to arrange the lines underneath the shapes. First, select all the rectangles.
15. In the Home tab, click the Arrange button, then choose Bring to Front.
16. If you feel like the slide isn't balanced, try one or both of these suggestions:
- Select the three rectangles in the leftmost column and their connection lines, then press the Left Arrow key on your keyboard until you like the spacing better.
- Select the Kathrin Hamilton and Ed West columns and their connection lines, then press the Right Arrow key the same amount of times. Drag the Peter Bowen to Kathrin Hamilton line until it's straight again.
17. Save the file.
Animating the Chart: Advanced Timing & Sequences
1. Click on the Peter Bowen rectangle to select only that shape.
2. From the Animations tab's green Entrance Effects, click the Float In effect. By default, this effect slowly pushes the element upward as if it were a buoyant, floating balloon. (It could also go downward).
3. Still in the Animations tab, in the Timing section, set Start to With Previous so that we don't need to click to start the animation.
4. Select the connector line between Peter Bowen and Mark Anderson.
5. From the Animations tab's green Entrance Effects, click the Shape effect. At the beginning of this effect, an invisible shape of your choosing (by default, a circle) covers the entire element. As the animation progresses, your content is revealed as the invisible shape shrinks. This effect is very customizable.
NOTE: There is also an Exit Effect with the same name. The entrance effect reveals content in this way, and the exit effect does the reverse by making it disappear. Remember that PowerPoint color-codes its animation effects by their roles in a sequence. Entrance effects are green, emphasis effects that transform elements already on-screen are yellow, and exit effects are red.
6. Let's reuse this effect on some of the other connectors and lines. With the connector still selected, press Cmd-Opt-Shift-C (Mac) or Alt-Shift-C (Windows) to copy the animation for multiple uses.
7. Click on the connector between Peter Bowen and Ed West to apply the effect.
8. Click on the line between Peter Bowen and Kathrin Hamilton. Nice!
9. With the line selected, in the Animations tab, click the Animation Painter button to deactivate it.
10. If the Animation Pane isn't already showing on the right, go into the Advanced Animation section and click the Animation Pane button.
11. In the Animation Pane on the right, select both the third and fourth animations (labeled 2 and 3 respectively).
12. In the Animations tab, in the Timing section, set Start to With Previous.
13. In the Animation Pane on the right, select the second animation (labeled 1).
14. In the Animations tab, in the Timing section, set Start to After Previous.
Therefore, Peter Bowen will animate in first, then the lines and connectors will animate in.
15. In the Animation Pane on the right, click on the first item in the list and then click Play From to preview the sequence of animations.
16. Select the three second-level gray/white gradient rectangles. (Click on one, then Shift-click the others to select all three.)
17. Right-click on the selection and choose Group > Group.
18. From the Animations tab's green Entrance Effects, click the Fade effect.
19. Still in the Animations tab, in the Timing section, set Start to After Previous, so that the gradient rectangles fade in after the elbow connectors and line.
20. Select Alicia Perkins, Jonathan Glover, and the lines above both.
21. Press Cmd-Opt-G (Mac) or Ctrl-G (Windows) to group them.
22. Drag a selection box around John Walker, Larry Hall, Robert Hyde, and all of the connectors or lines associated with them (be careful to get them all!).
23. Press Cmd-Opt-G (Mac) or Ctrl-G (Windows) to group them.
24. Drag a selection box around Laura Johnson and the line above her.
25. Press Cmd-Opt-G (Mac) or Ctrl-G (Windows) to group them.
26. Click on a blank area of the slide to deselect all.
27. In the exact order listed below, build a selection (using Shift-click) of all three of the groups that start with:
- Alicia Perkins
- John Walker
- Laura Johnson
28. From the Animations tab's green Entrance Effects, click the Wipe effect.
29. Click the Effect Options button and choose From Top.
30. Click on a blank area of the slide to deselect all.
31. At the top left of the group that contains the Alicia Perkins rectangle, click the numbered box to highlight it.
32. In the Animations tab, in the Timing section, set Duration to 00.75 so that it'll take 0.75 seconds for this group to animate in.
33. Click on the numbered box for the group that contains the John Walker rectangle.
34. In the Animations tab, in the Timing section, set Duration to 01.00 so that it'll take 1 second to animate in.
NOTE: Leave the Laura Johnson duration as is at 00.50.
|
Why We Set These Durations |
|---|
|
We left the Laura Johnson duration at 00.50. Why these exact durations? Laura's group is just her one rectangle, so hers needs the least amount of time to animate in (00.50). Alicia's group, however, has two rectangles, so hers needs more time (00.75). John's group has three rectangles, so his group needs even more time to animate in (01.00). It'll look like it takes the same amount of time for each rectangle to animate in: 00.25 for each rectangle. Good stuff! |
35. In the Animation Pane, select the last two animations (click on one then Shift-click the other to select them both).
36. In the Animations tab, in the Timing section, set Start to On Click.
NOTE: We chose On Click because when the presenter is speaking, they may want to call attention to these different branches of the hierarchy one at a time.
37. In the Animation Pane, click on the first item on the list and click the Play From button to preview the animations.
38. Clearly, hierarchical charts don't have to be boring. Save the file.
Master Microsoft Office
We offer the best Microsoft Office training in NYC. Learn how to create engaging presentations, generate reports on the fly, automate tasks, and more! Our expert instructors guide students of all levels through step-by-step projects with real-world applications. Sign up individually, or contact us about corporate training today: