
In this exercise, we're going to create and format a table slide. We will incorporate data from a separate, prepared table and jazz it up.
Getting Started
1. If you have any presentations open, in PowerPoint, go to File > Close to close them. You may have to close more than one.
2. Still in PowerPoint, go to File > Open to open the next project.
3. Under Open, click on On my Mac or This PC.
4. Navigate to the Desktop > Class Files > yourname-PowerPoint 2016 Class folder.
5. Double–click Table.pptx to open it.
6. Go to File > Open to open the old presentation we'll take the table data from.
7. Under Open, click on On my Mac or This PC.
8. Navigate to the Desktop > Class Files > yourname-PowerPoint 2016 Class folder.
9. Double–click Content.pptx to open it.
Creating a New Table & Copying Over Data
1. Switch to Table.pptx and in the Slides list, select the Leaf Works Model slide (Slide 9).
2. In the Home tab, click the arrow part of the New Slide button and choose Title and Content.
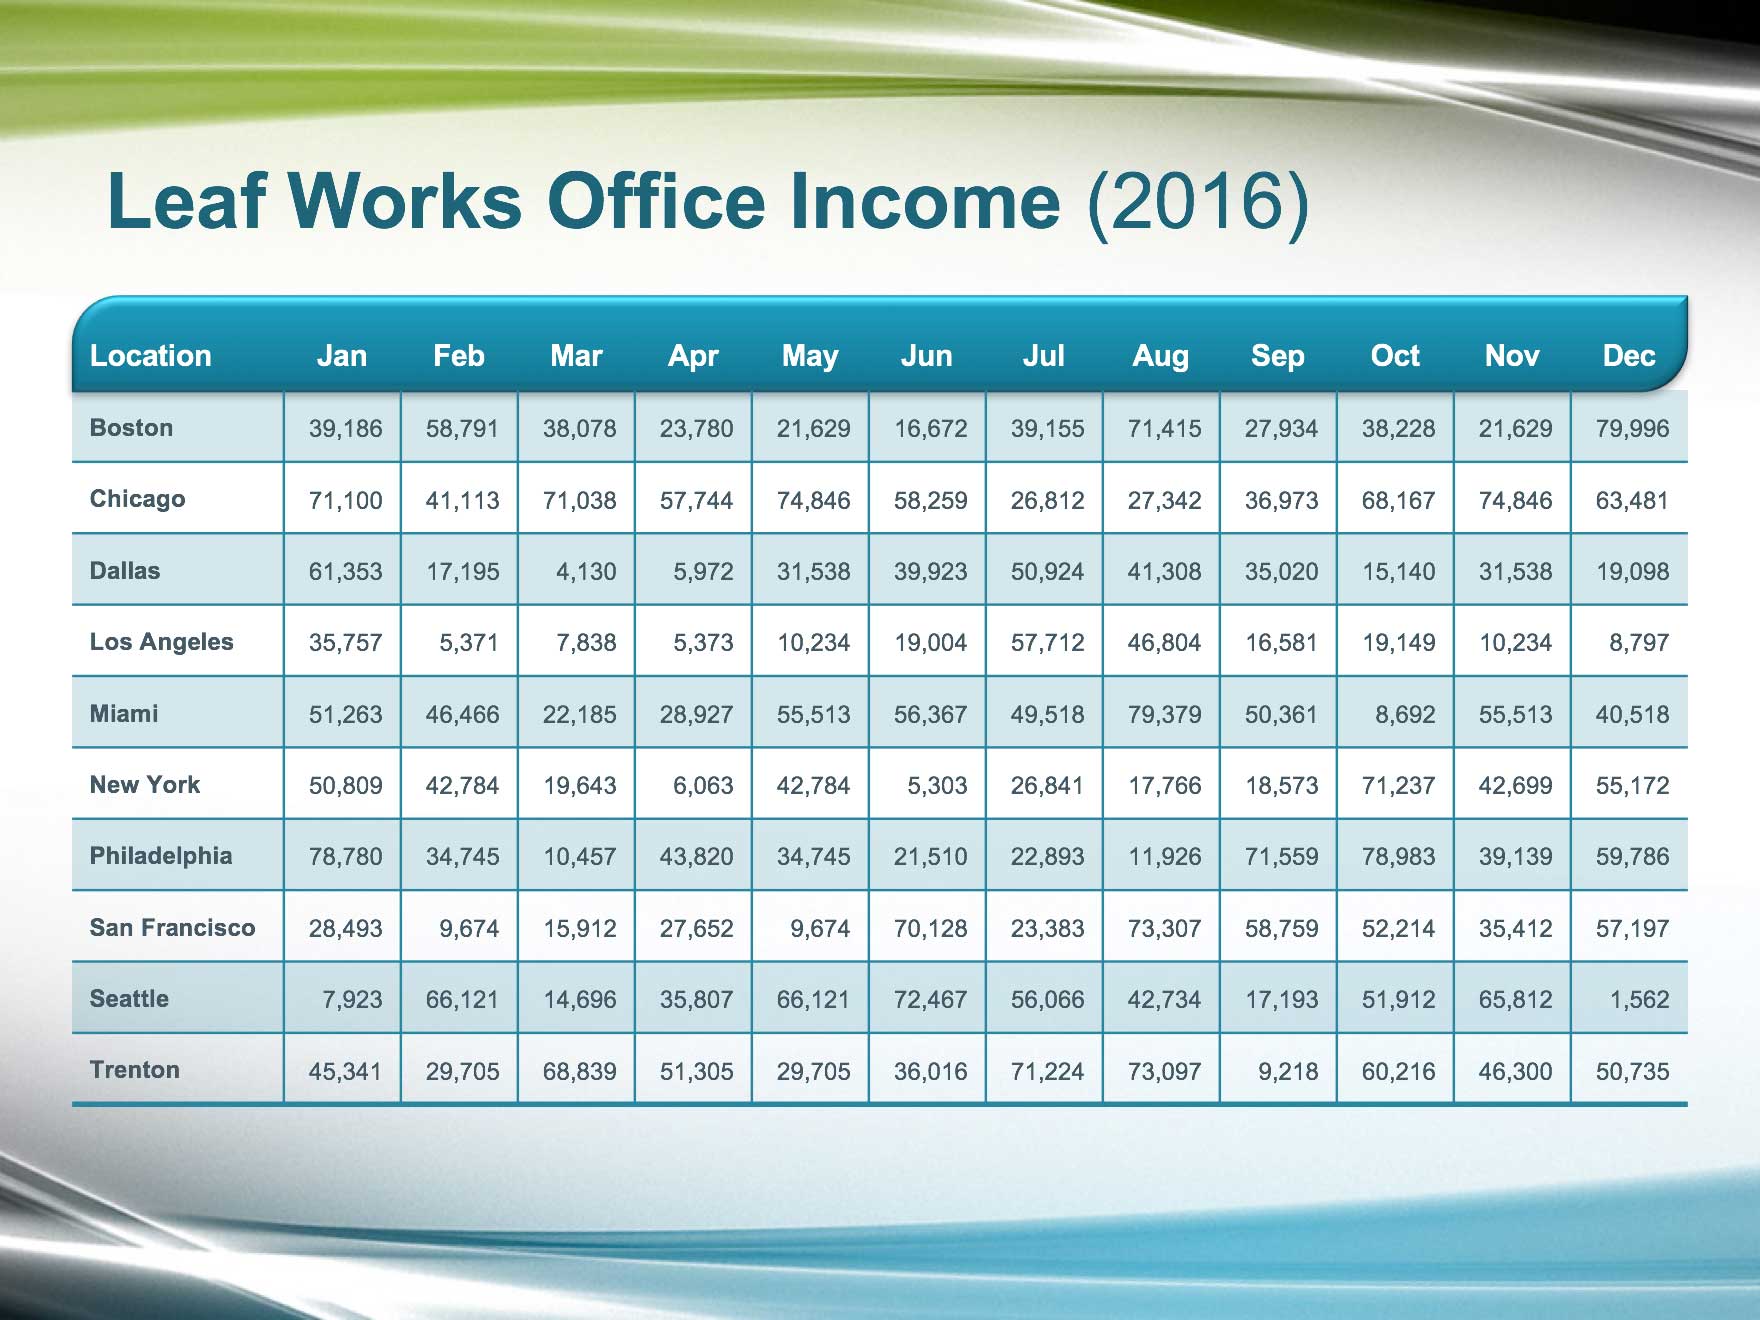
3. In the title placeholder, type: Leaf Works Office Income (2016)
4. Highlight the (2016) text (with the parentheses included) and click the Bold button to de-emphasize the year.
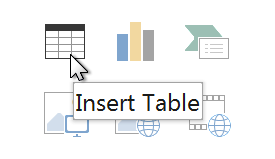
5. In the center of the content placeholder, click the Insert Table icon:
6. In the Number of columns field, type: 13
7. In the Number of rows field, type: 11
8. Click Insert (Mac) or OK (Windows) to create a default PowerPoint table.
9. Let's fill in the table with data from the old presentation. Switch to Content.pptx.
10. Go to the Leaf Works Office Income (2016) table slide located on Slide 9.
11. Before we can copy over this data to the new presentation, we need to select it. Click anywhere in the table's text, then select all.
12. Copy all of the table text.
13. Switch back to Table.pptx.
14. In the new table, click into any table cell then select all the cells.
15. Paste the new table data into the cells.
Don't panic!
16. In the Home tab, change the Font Size to 10 pt.
17. Change the Font to Arial.
18. Click a blank area of the slide to deselect the table.
19. Click into, then drag from the Boston cell down through the Trenton cell.
Those cells and the cells in between them should now be selected.
20. In the Home tab, click the Bold button to emphasize all of the cities. Yes, we know the Cities column is wonky!
Auto-Adjusting Size & Distributing Cells
Some of the city names are long, and are breaking onto two lines. Let's fix this.
1. Click on the divider between the first and second column and drag it slightly to the right to increase its width, so that the text in the first column doesn't wrap (at least, not as much).
2. Notice that it's impossible to adjust the divider without completely bleeding into the second column. Now we'll show you an alternate method.
3. Undo the previous edit with Cmd–Z (Mac) or Ctrl–Z (Windows).
4. Double–click on the divider between the first and second column. The column automatically adjusts the width of the column to fit its content! The rest of the columns have also been auto-adjusted. But the table is now too wide and hitting the right edge of the slide.
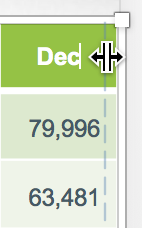
5. In the top-right corner of the table, click in the Dec cell. With the cursor in the cell, hover over the right edge of the cell until the cursor changes to a splitter, as depicted below.

6. Drag slightly to the left. A gray dashed vertical guide appears.
7. Drag the guide to the left so that the white space on the right side of the table approximately matches the white space on the left.
Only the Dec column has been adjusted. Let's fix the other columns.
8. Drag the cursor to select the top row of cells from Jan through Dec.
9. Look in the Ribbon at the top. Notice that there are two new tabs at the top:
- Mac: Table Design and Layout
- Windows: Table Tools > Design and Table Tools > Layout
NOTE: Because the name for these tabs is different on Mac and Windows, we'll refer to them as the (Table) Design and (Table) Layout tabs from now on.
10. Click on the (Table) Layout tab.
11. In the Cell Size section, click the Distribute Columns button.
The column spacing is now evenly distributed within the selected range. Yeow!
12. Actually, let's make the table a specific size. Click on the table's edge to select it.
13. Still in the (Table) Layout tab, in the Size section, make sure the Height is 4.46" and set Width to 9.18."
All of the column widths adjusted appropriately!
14. Click the Align button, then Align Center.
Table Styles & Border Formatting
1. Click on the table's bounding box, if it isn't already selected.
2. In the (Table) Design tab, in the Table Styles section, bring up a menu with more table styles using the instruction for your platform:
- Mac: Hover over the section and click the down arrow that appears.
- Windows: At the bottom right of the section, click the More button
3. In the menu, under Light, select the third choice from the left in the third row, Light Style 3 - Accent 2.
By setting the table style, we inadvertently changed the font. Also, our cities in the leftmost column are no longer bold. We'll just have to reapply these styles.
4. With the table still selected, in the Home tab, change the font back to Arial.
NOTE: If only one cell had the font applied to it, you had your cursor in that cell. Click on the table's bounding box and try again.
5. Select the cities in the first column and click the Bold button.
6. Next, let's set style parameters for the borders. Select the table's bounding box.
7. In the (Table) Design tab, in the Draw Borders section, click the Pen Style menu and choose No Border.
8. Still in the (Table) Design tab, in the Table Styles section, click the arrow part of the Borders button to select which type of border we want to remove.
9. From the menu, choose Outside Borders to remove the outermost borders.
10. Still in the Draw Borders section, click back in the Pen Style menu and choose Solid line (first option after No Border).
11. Click the Pen Weight menu and choose 2.25 pt.
12. Click the Pen Color button and select the sixth theme color, Turquoise, Accent 2.
13. Still in the Table Styles section, click the arrow part of the Borders button.
14. From the menu, choose Bottom Border to add a thick, solid turquoise border at the bottom of the table.
15. Deselect the table by clicking on a blank area.
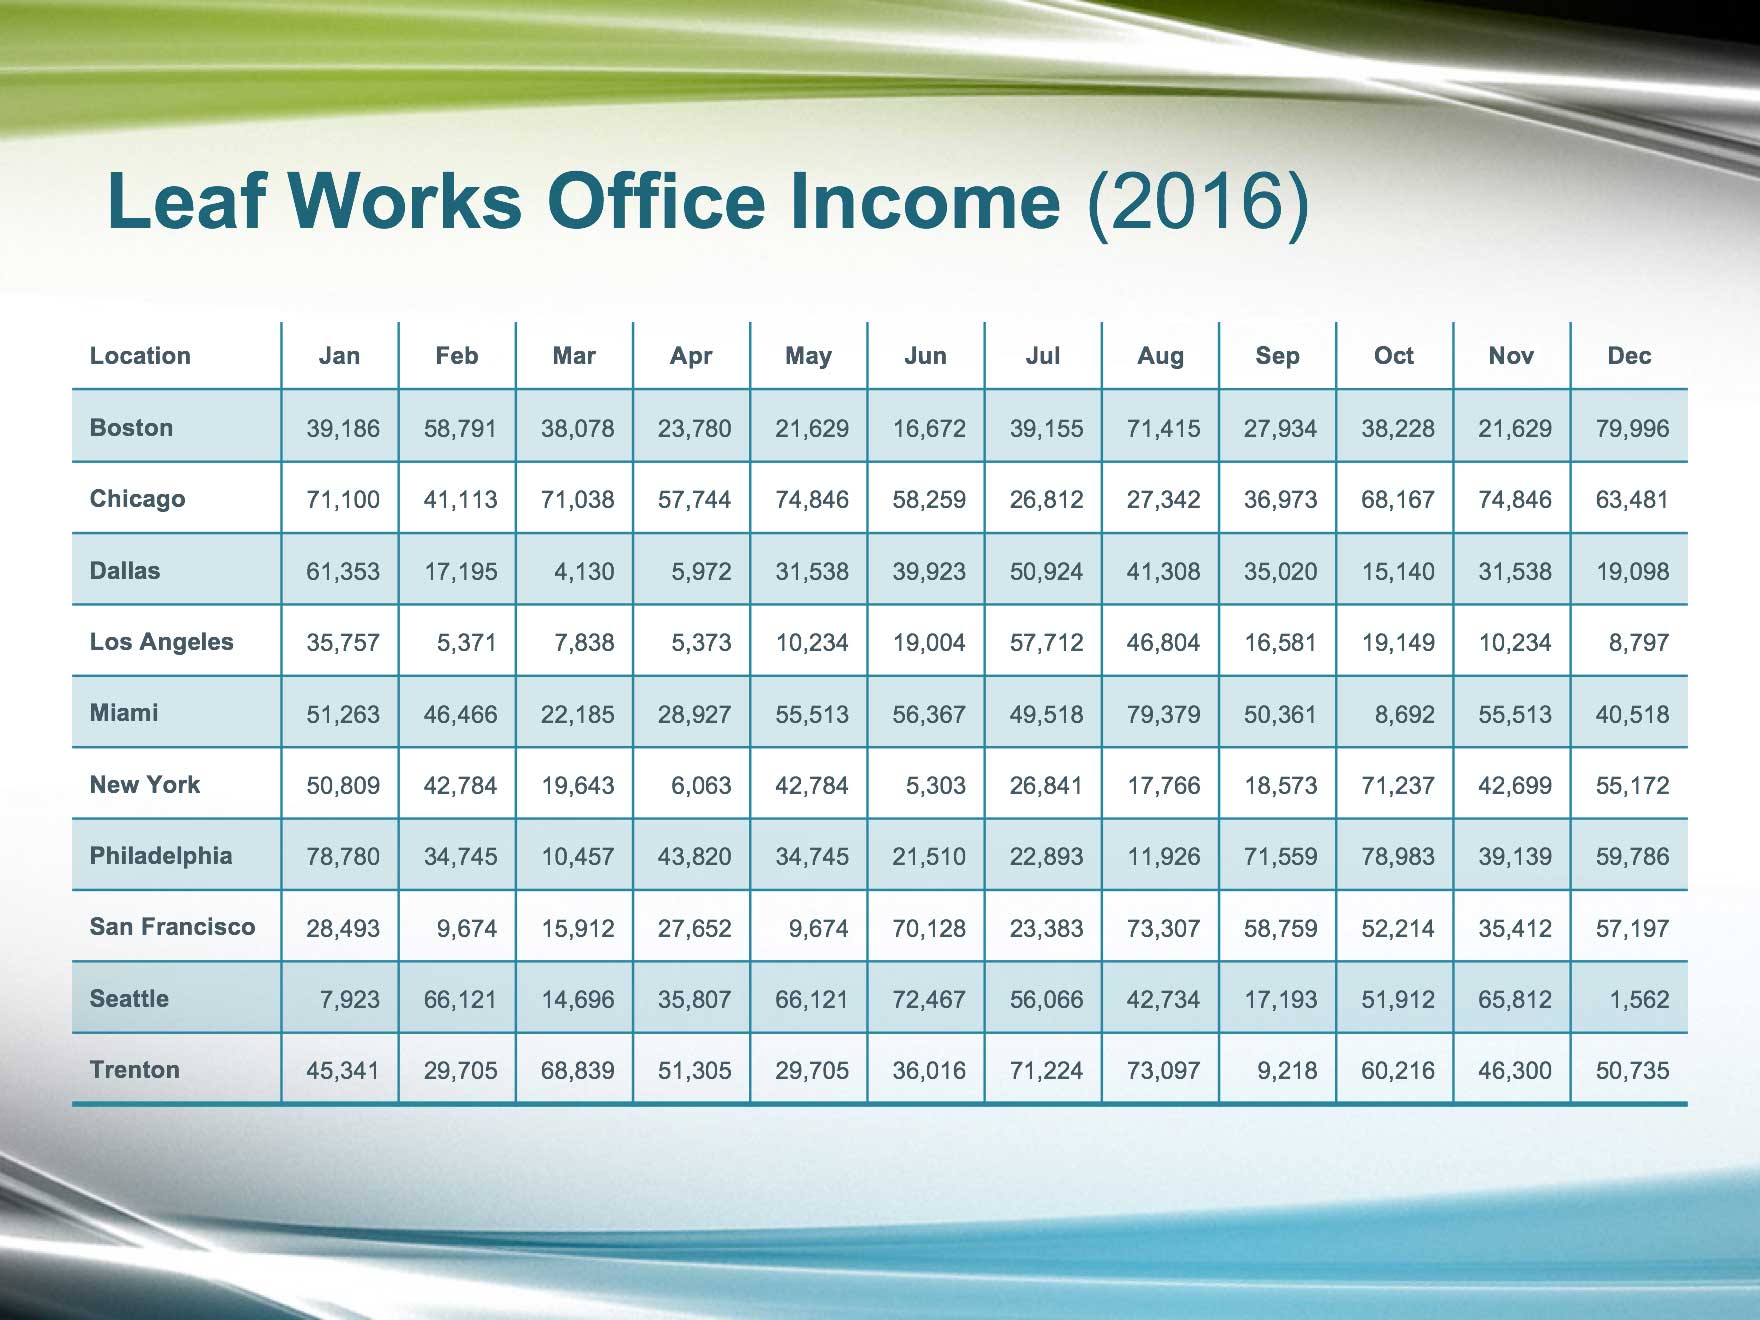
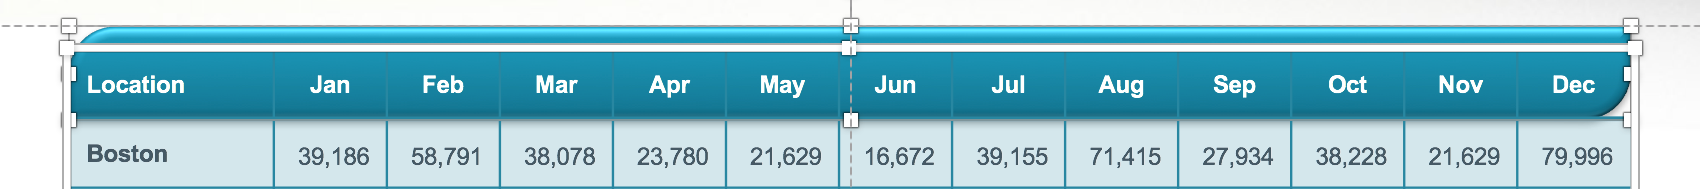
16. Check your work to make sure it looks like this:
Creating a Custom Table Header
Let's use a shape to create a special effect for the header row of the table.
1. In the Insert tab, click the Shapes button.
2. Under Rectangles, click the Round Diagonal Corner Rectangle shape (last one on the right).
3. Click on the slide to create a square. We'll give you exact coordinates next.
4. If it's not already selected, right-click on the square and choose Size and Position to bring up its properties in the Format Shape panel.
5. Under Size, set Height to 0.54" and Width to 9.18."
6. Under Position, set Vertical position to 1.59."
7. In the (Shape) Format tab, click the Align button, then Align Center to align the rectangle to the center of the slide.
8. In the (Shape) Format tab, in the Shape Styles section, reveal more options. Mac users can hover over the section's Abc icons and click the down arrow that appears. Windows users can click the More button to the bottom right of the section's Abc icons.
9. In the bottom row, in the turquoise column, select Intense Effect - Turquoise, Accent 2.
10. With the turquoise rectangle selected, drag the leftmost yellow handle as far to the right as possible to increase the rounded quality of the corners.
11. Right-click on the rectangle and choose Send to Back > Send to Back.
12. Click once in the table and drag the cursor to select the cells in the header row.
13. In the Home tab, set the Font Color to the first theme color, White, Background 1.
14. Set the Font Size to 12 pt.
15. With the header row cells still selected, in the (Table) Design tab, click the arrow part of the Borders button and choose No Border.
Using Drawing Guides to Align Content
1. Right-click on a blank area of the slide and choose Guides > Guides (Mac) or Grid and Guides > Guides (Windows).
2. Click on and hold the horizontal guide (near the top of the table).
Notice that the cursor disappears and a white box with the position coordinates appears in its place.
NOTE: If you encounter a bug in which the cursor covers the white box instead of disappearing, make sure the rulers are showing so it'll be easier for you to do the next step (go to the View tab and check on Ruler).
3. Drag the horizontal guide upwards to around 2.08."
We'll use the horizontal guide as our marker for the maximum vertical position of objects in the content area of all slides.
4. Drag a selection box around the table and the turquoise rectangle.
5. Make sure that the top of the table and rectangle aligns with the horizontal guide. If necessary, use the Arrow keys to nudge the table to align with the guide.
6. After you're finished aligning, Right-click on a blank area of the slide and under Guides (Mac) or Grid and Guides (Windows), UNcheck Guides.
7. That's it for our table! Save the file.
Master Microsoft Office
Microsoft Office is a suite of productivity tools that benefit not only individual users, but whole teams. Learn how to harness the full power of Office for your business. We offer the best Microsoft Office training in NYC. Our expert instructors offer years of industry experience and help students create engaging presentations, dynamic reports, and more. Sign up individually, or contact us about corporate training today: